Manufacturing
October 05 2026
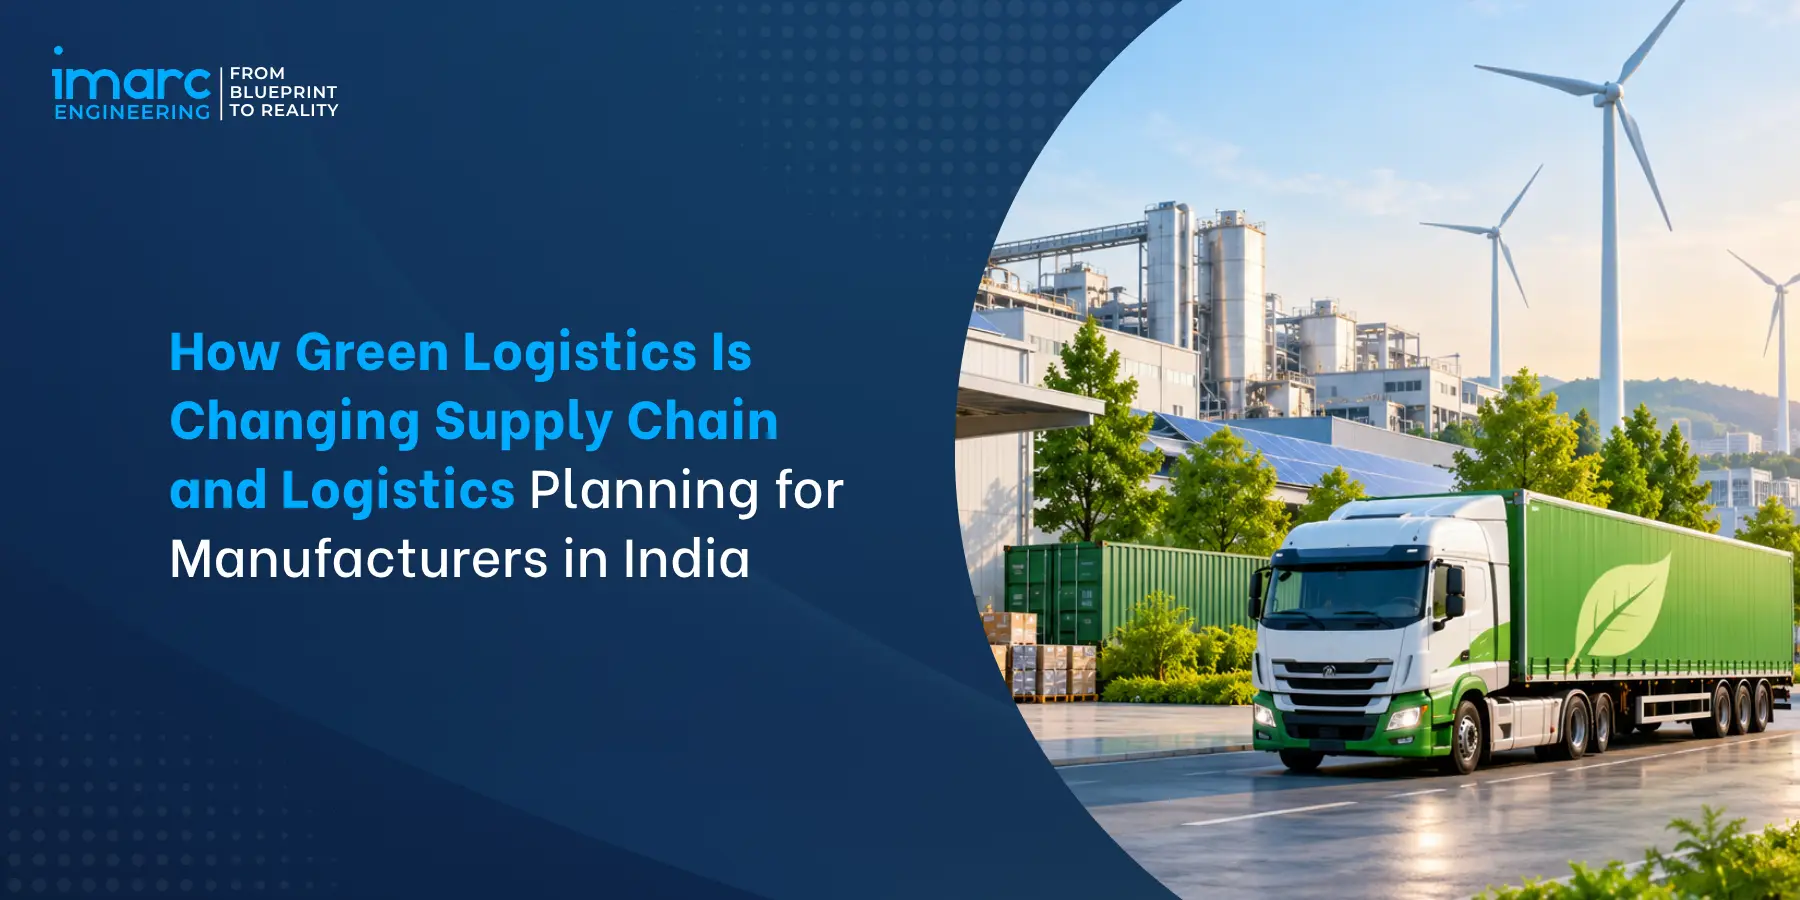
How Green Logistics Is Changing Supply Chain and Logistics Planning for Manufacturers in India
Introduction
For plant heads, supply chain leaders, and logistics managers at Indian manufacturers, green logistics in India is not an ESG checkbox - it is a practical supply chain optimization lever. Modal shift from road to rail, better route and load planning, warehouse network redesign, inventory positioning closer to demand, EV adoption under PM E-DRIVE, and digital visibility through the Unified Logistics Interface Platform (ULIP) all cut cost and emissions together. The National Logistics Policy 2022 targets reducing India's logistics cost from around 13-14 percent of GDP to 8-10 percent by 2030, aligning commercial and environmental objectives.
Scope of this Guide
This guide walks through green logistics for manufacturers as a commercial optimization framework. It covers supplier networks, inbound flows, transport mode selection, multimodal corridors, route and load optimization, warehouse location, inventory positioning, EV and alternative-fuel freight, digital logistics, reverse logistics, and the trade-offs between cost, service levels, resilience, and sustainability for a manufacturing network in India.
Table of Contents
- Introduction
- Why Green Logistics Matters for Manufacturers in India in 2026
- What Green Logistics in Manufacturing Means and Why It Matters in India
- Supplier Network and Inbound Logistics Planning for Manufacturers in India
- Multimodal Transportation and Freight Mode Selection for Manufacturers in India
- Route Load and Shipment Optimization for Manufacturing Logistics in India
- Warehouse Location Inventory Positioning and Distribution Network Design in India
- EV Freight Alternative Fuels Digital Logistics and Reverse Logistics in India
- Balancing Cost Service Resilience and Sustainability in Manufacturing Logistics in India
- Conclusion
1. Why Green Logistics Matters for Manufacturers in India in 2026
Four drivers make green logistics strategically important for Indian manufacturers in 2026.
1.1 National Logistics Cost Reduction Agenda
India's logistics cost has historically run around 13-14 percent of GDP - meaningfully higher than developed-economy benchmarks of 8-10 percent. The National Logistics Policy launched on 17 September 2022 targets closing this gap by 2030 along with a top-10 Logistics Performance Index position. The policy operates through four pillars - Integrated Digital Logistics Systems (IDLS), Standardisation of physical assets and services, Human Resources Development, and State Engagement via the LEADS (Logistics Ease Across Different States) ranking. For manufacturers, this macro agenda translates into concrete opportunities - cheaper rail freight through DFCs, standardised multimodal interchange at MMLPs, and digital visibility through ULIP.
1.2 Infrastructure Readiness
PM Gati Shakti National Master Plan launched on 13 October 2021 58 Central Ministries/Departments and all 36 States/UTs onto a unified GIS-based platform integrating Bharatmala highways, Sagarmala ports, DFCs, inland waterways, UDAN airports, and BharatNet. The Eastern Dedicated Freight Corridor (Ludhiana-Sonnagar, 1,337 km) and Western Dedicated Freight Corridor (JNPT-Dadri, 1,506 km) - together 2,843 km of dedicated freight rail - are operational, enabling faster, heavier rail freight on key industrial corridors. Multimodal Logistics Parks under Bharatmala, port connectivity under Sagarmala, and expanding gas pipeline and LNG station networks together build the infrastructure needed for a modal shift from road toward rail, water, and alternative-fuel freight.
1.3 Freight Electrification Momentum
The PM E-DRIVE Scheme notified by the Ministry of Heavy Industries in September 2024 with an outlay of INR 10,900 crore marked the first dedicated central support for electric trucks. INR 500 crore is specifically allocated to e-trucks, incentivising 5,643 N2 (3.5-12 tonnes) and N3 (12-55 tonnes) category trucks with up to INR 9.6 lakh per vehicle, linked to scrapping of old diesel trucks.
The scheme has been extended to March 2028 for e-trucks, buses, and charging infrastructure. For cement, steel, FMCG, and other high-freight manufacturers, this creates a credible economic pathway for EV freight adoption on short-to-medium haul lanes.
1.4 Customer and Reporting Pressure
BRSR (Business Responsibility and Sustainability Reporting) under SEBI (LODR) Regulations is mandatory for the top 1,000 listed companies, with BRSR Core assured reporting rolling out progressively. Scope 3 upstream and downstream transport emissions sit within supply chain scope, pushing manufacturers to measure and reduce freight carbon intensity.
Multinational OEMs mandate supplier CO2 disclosures, and large customers increasingly specify logistics emission factors in RFQs. For manufacturers supplying export markets, EU CBAM (Carbon Border Adjustment Mechanism) carbon intensity on exports further raises the stakes. Green logistics has moved from a sustainability narrative to a procurement precondition.
2. What Green Logistics in Manufacturing Means and Why It Matters in India
Understanding what green logistics in manufacturing means and why it matters in India establishes the commercial framework for decisions on freight, warehousing, inventory, and network design.
2.1 Definition and Commercial Scope
Green logistics in manufacturing is the discipline of redesigning supplier networks, inbound and outbound freight, transportation modes, routes, loads, warehouses, inventory positioning, distribution channels, and reverse flows to reduce total logistics cost and carbon emissions simultaneously - while preserving or improving service levels, lead times, and operational reliability. It is a supply chain optimization problem with environmental variables added, not a stand-alone sustainability program. Levers include modal shift to rail and multimodal, route and load optimization, warehouse and inventory redesign, EV and alternative-fuel freight, shipment consolidation, digital visibility, and reverse logistics. All of these can reduce commercial cost per tonne-kilometre or per order delivered while also reducing emissions.
2.2 Supply Chain Levers and Their Impact
| Lever | Cost Impact | Emissions Impact |
|---|---|---|
| Modal shift to rail/water | Lower per-tonne-km | Significantly lower |
| Route optimization | Fewer km driven | Lower fuel burn |
| Load optimization | Higher utilization | Fewer vehicle trips |
| Warehouse redesign | Lower network cost | Shorter freight distances |
| EV adoption (short haul) | Lower OPEX long-term | Zero tailpipe |
| Digital visibility | Lower idle, dwell time | Reduced wasted trips |
| Reverse logistics | Material recovery value | Circular - fewer new inputs |
2.3 Why This Matters Commercially
For manufacturers, logistics is a significant cost line - typically 4-12 percent of sales depending on sector, product density, and distribution reach. A 10-15 percent improvement in logistics cost drops directly to EBITDA. Manufacturing logistics in India is also a service-level lever - inventory availability, promised delivery lead times, OTIF (on-time in-full) performance, and after-sales serviceability all depend on logistics design.
Green logistics methods (modal shift, consolidation, digital visibility, warehouse redesign) frequently improve these commercial metrics alongside environmental ones. Treating green logistics as a cost and service optimization program, with emissions as a tracked outcome, aligns the CFO, plant head, supply chain head, and sustainability team around a shared agenda.
3. Supplier Network and Inbound Logistics Planning for Manufacturers in India
Understanding supplier network and inbound logistics planning for manufacturers in India covers the upstream flows that typically account for 40-60 percent of a manufacturer's total logistics spend.
3.1 Supplier Network Design
Supplier network design is the foundation of inbound efficiency. Rationalising supplier count and location, consolidating tier-2/tier-3 vendors into regional hubs, qualifying local alternatives for high-volume commodity items, and designing in dual sourcing for critical inputs reduces inbound freight distance, improves negotiating leverage, and strengthens supply resilience.
Supplier location proximity to the plant - whether greenfield supplier parks adjacent to the OEM facility (common in automotive) or clustering within an industrial corridor - directly reduces inbound tonne-km. Green logistics methods applied to supplier design include preference for suppliers near rail nodes, DFC-adjacent industrial clusters, and MMLP catchments.
3.2 Inbound Freight Planning
Inbound logistics planning covers mode selection (road, rail, multimodal), consolidation (milk runs, cross-docking at consolidation centres), carrier selection, and scheduling. Milk run collection from multiple geographically clustered suppliers converts partial truckloads into full-truckload movements - reducing cost per unit delivered and raising vehicle utilization.
Cross-docking at an inbound consolidation centre near the plant lets suppliers deliver smaller shipments while the OEM receives full-truckload inflows. VMI (vendor managed inventory) arrangements shift inbound planning to the supplier with service-level agreements. These methods are already standard in automotive and FMCG and are increasingly applied in process-industry inbound streams.
3.3 Modal Choice for Inbound Streams
Mode selection on inbound streams depends on origin-destination distance, commodity density, time sensitivity, and reliability requirement. Long-haul inbound of bulk commodities (coal, steel, cement raw materials, chemicals, agri feedstock) is a strong candidate for rail - especially on DFC-connected lanes. Shorter-haul and time-sensitive inbound (JIT automotive parts, perishables, high-value electronics) typically stays on road. Multimodal (road-rail-road) via Container Freight Stations and Multimodal Logistics Parks suits medium-distance containerised flows. Decisions are rarely binary - a well-designed network uses road, rail, and multimodal in parallel on different lanes to optimize cost, time, and emissions together.
4. Multimodal Transportation and Freight Mode Selection for Manufacturers in India
Understanding multimodal transportation and freight mode selection for manufacturers in India enables deliberate choice across road, rail, waterways, and coastal shipping.
4.1 Road Freight Characteristics
Road freight dominates Indian freight movement (historically around 60-65 percent of tonne-km share) due to door-to-door flexibility, broad geographic coverage, and dense carrier markets. It is best suited for short-to-medium hauls (typically below 500-700 km), time-sensitive shipments, less-than-truckload movements, last-mile distribution, and locations without rail access.
On longer hauls road freight is more expensive and more carbon-intensive per tonne-km than rail or coastal shipping. GST E-Way Bill under GST Act 2017 is mandatory for inter-state movement above INR 50,000, and ULIP integration with FASTag improves visibility and reduces checkpoint delays.
4.2 Rail Freight and Dedicated Freight Corridors
Rail freight offers lower cost per tonne-kilometre on long hauls (typically above 500-700 km) and significantly lower emissions than road - electric traction further widens this gap. The Eastern Dedicated Freight Corridor (Ludhiana to Sonnagar, 1,337 km) and Western Dedicated Freight Corridor (JNPT to Dadri, 1,506 km) together provide 2,843 km of dedicated freight rail - enabling heavier trains, higher speeds, and better reliability than mixed-traffic routes.
WDFC supports double-stack container operations. For manufacturers near these corridors or linked via feeder routes, modal shift from road to rail for bulk commodities, containerised finished goods, and inter-plant movements offers meaningful cost and emissions reductions.
4.3 Coastal Shipping and Inland Waterways
Coastal shipping along India's 7,500+ km coastline moves bulk cargo (cement, steel, fertilizer, coal, petroleum) between major ports under the Sagarmala framework. Coastal shipping comparatively has the lowest emissions per tonne-km. Inland waterways under the National Waterways Act 2016 cover 111 declared national waterways - with NW-1 (Ganga-Bhagirathi-Hooghly) and NW-2 (Brahmaputra) being the most active for commercial cargo.
Barge and container movement on inland waterways is viable for suitable origin-destination pairs, especially for low-value, non-time-critical cargo. For most manufacturers, waterways integrate as a leg within multimodal flows rather than as a sole mode.
4.4 Multimodal Logistics Parks
Multimodal logistics in India is anchored on Multimodal Logistics Parks (MMLPs) being developed under Bharatmala across identified industrial clusters. MMLPs offer road-rail-air-port integration, warehousing, container handling, bonded storage, and value-added services - allowing manufacturers to switch modes efficiently along the freight journey.
For a manufacturer, locating distribution centres near MMLPs reduces road-to-rail transfer friction, shortens multimodal transit times, and brings access to a dense carrier ecosystem. Decision tools for mode selection include landed cost per tonne, transit time, reliability, carbon intensity, and seasonality - integrated into a lane-by-lane mode choice matrix rather than a blanket policy.
5. Route Load and Shipment Optimization for Manufacturing Logistics in India
Understanding route load and shipment optimization for manufacturing logistics in India covers the operational levers that typically deliver the fastest and most verifiable logistics cost and emissions reductions.
5.1 Route Optimization
Route optimization uses algorithmic engines (vehicle routing problem solvers) to plan multi-stop routes minimizing total distance, time, or cost - subject to time-window, vehicle-capacity, and driver-hour constraints. Modern TMS (Transport Management System) platforms integrate traffic data, fuel cost, toll (FASTag), and historical lane performance to generate optimized routing.
For primary freight on fixed OEM-to-DC lanes, optimization focuses on lane selection, carrier assignment, and schedule. For secondary distribution and last-mile, optimization handles multi-drop sequencing, time windows, and vehicle-task matching. Fewer kilometres and avoided deadhead directly cut fuel burn, driver cost, and emissions - with payback measured in weeks rather than years.
5.2 Load Optimization and Vehicle Utilization
Load optimization increases cube and weight utilization within each vehicle through better packing, pallet design, container loading, and shipment combining. 3D load planning tools (axle load compliance, stack sequencing) raise fill rates. On the demand side, shipment consolidation combines multiple smaller orders into full-truckload or full-container movements - using regional consolidation centres, cross-docks, or hub-and-spoke networks.
Backhaul matching - returning vehicles carrying loads instead of running empty - raises asset productivity and cuts cost per laden kilometre. Across inbound and outbound, consolidated flows reduce vehicle trips, driver hours, fuel burn, and emissions proportionately.
5.3 Freight Visibility and Digital Platforms
Freight visibility through GPS tracking, telematics, TMS, and the Unified Logistics Interface Platform (ULIP) is foundational to optimization. Visibility reduces idle time, enables dynamic rerouting, verifies on-time performance, and generates fuel and emissions data for Scope 3 reporting. ULIP integrates GST E-Way Bill, FASTag, Vahan, Sarathi, railway cargo data, and other government logistics data sources into a single platform - letting manufacturers and logistics providers query shipment status, documents, and infrastructure availability. Combined with carrier-side telematics, this creates the data layer for lane analytics, continuous improvement, and emissions tracking across the manufacturing freight network.
5.4 Last-Mile Logistics
Last-mile distribution to retail outlets, dealer networks, or industrial customers accounts for a disproportionate share of outbound logistics cost and emissions - typically 20-40 percent of total outbound cost. Methods include zone-based routing, time-window delivery, pool points for shared last-mile, electric light commercial vehicles for urban deliveries (now eligible under PM E-DRIVE support), and dark store models for e-commerce fulfilment.
For B2B last-mile, delivery scheduling (slot booking at customer DCs) reduces wait time and improves asset utilization. Measurement discipline (cost per drop, drops per hour, OTIF, failed delivery rate) separates well-run last mile from the rest.
Build a more resilient and cost-efficient supplier network with IMARC Engineering's Strategic Sourcing Services.
6. Warehouse Location Inventory Positioning and Distribution Network Design in India
Understanding warehouse location inventory positioning and distribution network design in India covers the structural levers that reshape total logistics cost and service levels.
6.1 Warehouse Location Strategy
Warehouse location drives inbound freight distance from plants, outbound freight to customers, lead time, and service coverage. The GST regime (effective July 2017) eliminated inter-state warehouse arbitrage that had previously inflated India's warehouse count - allowing consolidation into fewer, larger, better-located warehouses.
Modern network design uses demand clustering, centre-of-gravity analysis, line haul versus last-mile trade-off curves, and MMLP/DFC adjacency to decide warehouse count, size, and location. Depending on the existing network, demand distribution and service requirements, warehouse network redesign can reduce unnecessary facilities, inventory duplication and secondary distribution distances while maintaining or improving service levels.
6.2 Inventory Positioning
Inventory positioning across central, regional, and forward warehouses balances holding cost against stockout risk and service levels. Fast-moving SKUs often sit at forward DCs close to demand; slow-moving long-tail SKUs centralize to pool safety stock and reduce total inventory. ABC-XYZ segmentation (volume by variability) guides positioning policy. Postponement strategies (finishing goods closer to the customer) and multi-echelon inventory optimization models further reduce total inventory while maintaining service. Reduced inventory means lower working capital, less storage space, and fewer expedited (air or rush-road) shipments - all of which carry cost and emission benefits.
6.3 Green Warehousing
Green warehousing in India extends sustainability into the warehouse itself. Levers include rooftop solar (behind-the-meter PV), energy-efficient LED lighting with motion sensors, HVAC optimization, insulated building envelopes, rainwater harvesting, recycled water for washing and landscaping, EV charging stations for inbound/outbound trucks, and automation (ASRS, conveyors, WMS-driven put-away) that reduces energy per throughput.
IGBC Green Warehouse ratings and LEED certifications provide third-party frameworks. For large distribution hubs, warehouse-side solar can offset a meaningful share of electricity cost - with payback periods often under 5-6 years at current tariff and panel prices.
6.4 Distribution Network Design
Distribution network design integrates plant locations, warehouse network, transport modes, and customer-facing distribution channels into a cohesive flow. Common patterns include direct plant-to-customer (large customers, bulk shipments), plant-to-central warehouse-to-regional DC-to-customer (typical FMCG), hub-and-spoke with cross-docks (automotive aftermarket), and milk-run collection with central deconsolidation (automotive inbound).
Network redesign using scenario modelling tools evaluates total cost (fixed + variable + inventory + transport), service levels, carbon emissions, and resilience under alternative configurations. For a mid-size manufacturer, a full network redesign typically identifies 10-20 percent total logistics cost reduction while shortening lead times.
7. EV Freight Alternative Fuels Digital Logistics and Reverse Logistics in India
Understanding EV freight alternative fuels digital logistics and reverse logistics in India covers the technology-driven levers that complement network and operational optimization.
7.1 EV Freight and PM E-DRIVE Incentives
The PM E-DRIVE Scheme (September 2024, INR 10,900 crore outlay) is the central framework for EV freight adoption. INR 500 crore is reserved for e-trucks - supporting 5,643 N2 (3.5-12 tonnes) and N3 (12-55 tonnes) category trucks with incentive up to INR 9.6 lakh per vehicle, linked to mandatory scrapping of old diesel trucks at authorised facilities. Vehicles must comply with AIS 039 energy consumption standards and CMVR norms.
The scheme has been extended to March 2028 for e-trucks, buses, and charging infrastructure (INR 2,000 crore for public charging). For manufacturers in cement, steel, FMCG, ports, and intra-city distribution, electric light commercial vehicles and medium-duty trucks are increasingly viable on short-to-medium haul lanes with predictable duty cycles and depot-based charging.
7.2 Alternative Fuel Vehicles
Alternative fuel vehicles complement EV adoption on long-haul and heavy-duty applications where battery electric is less economic. CNG for medium commercial vehicles is widespread on urban lanes with developed CNG station networks. LNG trucks for long-haul heavy-duty freight are being piloted along LNG highway corridors by PSU oil marketing companies.
Biodiesel blending (B5 to B20 depending on market) under the National Policy on Biofuels 2018 is available in diesel-heavy fleets. Green hydrogen trucks are at pilot stage under the National Green Hydrogen Mission (2023). For manufacturers, alternative-fuel adoption is route-specific - driven by fuel availability along the lane, vehicle TCO, maintenance ecosystem, and policy incentives.
7.3 Digital Logistics and Automation
Digital logistics covers TMS (Transport Management System), WMS (Warehouse Management System), control towers, visibility platforms, telematics, electronic documentation, and analytics. ULIP as a government-side integration platform plus private digital freight platforms (digital brokerage, visibility apps, fleet management SaaS) together create the data and workflow backbone for optimization.
Logistics automation extends into warehouse automation (ASRS, AGVs, pick-to-light, voice picking, robotics), yard management, and last-mile technology (route planning apps, electronic proof of delivery). For manufacturers, phased digital investment (start with TMS and visibility, add WMS, then selective automation at high-throughput nodes) typically shows faster payback than big-bang transformation.
7.4 Reverse Logistics
Reverse logistics covers product returns (customer returns, warranty), packaging returns (pallets, crates, intermediate bulk containers, dunnage), end-of-life product take-back (EPR under E-Waste Rules 2022, Battery Waste Management Rules 2022, Plastic Waste Rules 2016 with 2022 amendments), and material recovery (recycling, remanufacturing).
Reverse flows have traditionally been underoptimized in Indian manufacturing. A well-designed reverse logistics program recovers packaging value (reusable containers can turn 20-100+ cycles), reduces disposal cost, supports EPR compliance, and enables circular manufacturing. Dedicated reverse-flow carriers, reverse-flow TMS modules, and consolidated collection networks are the operating backbone.
8. Balancing Cost Service Resilience and Sustainability in Manufacturing Logistics in India
Understanding balancing cost service resilience and sustainability in manufacturing logistics in India is the governance frame that keeps green logistics commercially credible.
8.1 The Four-Way Trade-off
Logistics decisions sit at the intersection of four objectives - cost (per tonne-km, per order), service levels (lead time, OTIF, fill rate), supply chain resilience (dual sourcing, buffer inventory, alternative routes), and sustainability (emissions, energy, materials). These are not always aligned - rail freight is cheaper and lower-emission but slower than road; higher safety stock improves service and resilience but raises cost and warehouse emissions; EV adoption lowers emissions but needs charging infrastructure and higher upfront cost; multimodal reduces cost and emissions but adds complexity. Mature manufacturers set explicit weights across the four objectives at the lane, SKU, and customer-segment level - rather than pursuing a single-dimension optimum.
8.2 Resilience Design
Supply chain resilience requires designed redundancy - dual sourcing on critical items, multi-carrier contracts on key lanes, geographic diversification of warehouses, strategic safety stock on long-lead items, and alternative-mode playbooks for lane disruptions. Lessons from the 2020-2022 period reinforced the cost of over-concentration.
Resilience is sometimes framed as opposing cost efficiency, but careful design (regional buffer at MMLP, modal alternates on DFC lanes, EV fleet for short-haul backup) can deliver both. Green logistics methods frequently improve resilience as a side-effect - shorter supplier distances, warehouse-side solar, local last-mile EV capacity all reduce exposure to upstream disruptions.
8.3 Measurement and Governance
Measurement discipline is essential. Core KPIs span cost (cost per tonne-km, cost per order, logistics cost as percent of sales), service (OTIF, perfect order rate, lead time, fill rate), resilience (single-source exposure, inventory days of cover, carrier concentration), and sustainability (CO2 per tonne-km, modal share, EV share, warehouse energy intensity).
Reporting cadence combines operational dashboards (weekly), management review (monthly), and manufacturing logistics strategy review (quarterly or annual). Governance assigns clear accountability - supply chain head owns network design, logistics operations head owns execution, sustainability team owns Scope 3 and BRSR reporting, finance validates cost outcomes. Aligned incentives across these functions prevent single-dimension optimization.
8.4 Implementation Roadmap
| Phase | Focus | Illustrative Outcomes |
|---|---|---|
| Diagnostic | Lane analytics, cost baseline, modal mix | Opportunity map, baseline KPIs |
| Quick wins | Route/load opt, carrier mix, visibility | Short-cycle cost and emission cuts |
| Structural | Network redesign, warehouse rationalization | Lower network cost and lead time |
| Transition | EV pilots, rail shift, alternative fuels | Modal share and EV share growth |
| Scale | Digital rollout, reverse logistics, SOP | Sustained performance and reporting |
Conclusion
Green logistics in India in 2026 is a supply chain optimization approach that integrates environmental objectives with cost, service, and resilience. Policies and infrastructure such as the National Logistics Policy, PM Gati Shakti, Dedicated Freight Corridors, Multimodal Logistics Parks, ULIP, and PM E-DRIVE support modal shifts, route and load optimization, network redesign, cleaner freight, digital visibility, and reverse logistics.
Manufacturers should start with lane-level data and baseline KPIs before investing in EV fleets or network redesign. Solutions should be tailored to freight volumes, routes, transport modes, SKUs, and network configuration. Cost, service, resilience, and emissions outcomes should be evaluated together rather than through blanket benchmarks.
PLANNING YOUR GREEN LOGISTICS TRANSFORMATION IN INDIA?
IMARC Engineering supports manufacturers with logistics diagnostics, network and warehouse planning, multimodal transport strategy, route and load optimization, inventory positioning, green warehousing, EV and alternative-fuel adoption, digital logistics platforms, reverse logistics, EPR compliance, and Scope 3 emissions tracking.
→ Schedule a free green logistics scoping consultation with an IMARC specialist
Frequently Asked Questions
Green logistics in India combines manufacturing supply chain optimization with environmental objectives - redesigning inbound/outbound freight, transportation modes, routes, warehousing, inventory positioning, and reverse logistics to reduce logistics cost, carbon emissions, and inefficiencies while maintaining service levels, lead times, and reliability across the manufacturing network.
Manufacturers in India implement green logistics through supplier network rationalization, modal shift from road to rail/multimodal, route and load optimization, warehouse location redesign, inventory positioning, shipment consolidation, EV adoption under PM E-DRIVE for N2/N3 trucks, digital logistics platforms (ULIP), reverse logistics, and continuous carbon tracking.
Green logistics for manufacturers reduces logistics costs through route optimization (fewer kilometres), load optimization (higher utilization), modal shift to rail/multimodal (lower per-tonne cost on long hauls), warehouse network consolidation, inventory positioning (lower safety stock), shipment consolidation, EV adoption (lower fuel/maintenance OPEX), and reduced empty running.
Multimodal transportation in India combines road, rail, inland waterways, and coastal shipping via Dedicated Freight Corridors (WDFC and EDFC), MMLPs, and PM Gati Shakti infrastructure. Benefits include lower per-tonne-km cost on long hauls, reduced road congestion, lower emissions, and better reliability than single-mode road freight.
Route optimization reduces freight kilometres through algorithmic path selection accounting for distance, traffic, time windows, and multi-drop sequencing. Load optimization increases vehicle utilization through cube/weight-based planning, shipment consolidation, backhaul matching, and reduced empty running - jointly cutting cost per tonne-km and emissions across inbound/outbound freight.
Warehouse location drives inbound and outbound freight distance, lead time, and service coverage. Inventory positioning across central, regional, and forward warehouses balances holding cost against stockout risk and service levels. Network redesign using demand clusters, line-haul vs last-mile tradeoffs, and MMLPs can reduce logistics cost.
EV freight (N2/N3 e-trucks under PM E-DRIVE) and alternative fuels (CNG, LNG, biodiesel, green hydrogen pilots) reduce tailpipe emissions. Digital logistics (TMS, WMS, ULIP) enables visibility, route optimization, and consolidation. Reverse logistics recovers packaging, returns, and end-of-life products supporting circular manufacturing and extended producer responsibility.
Manufacturers balance logistics cost, service levels, and sustainability by segmenting flows (fast-moving vs slow-moving, inbound vs outbound), applying modal shift to rail/multimodal on long hauls, keeping road for last-mile, maintaining dual sourcing for resilience, using digital platforms for visibility, and tracking ownership cost alongside emissions.
Recent Post
Trusted by Industry Leaders
We partner with global enterprises and ambitious businesses across sectors to deliver operational excellence, strategic insights, and sustainable growth through integrated solutions.






Success in Their Words
Real feedback from clients across industries. Discover how our solutions delivered measurable impact and operational excellence.

I wanted to express my sincere appreciation for your efforts in handling this matter. Your dedication and commitment have been truly commendable, and it is evident that you have put in tremendous hard work and expertise into resolving the issues at hand. We are greatly interested in continuing our collaboration with you in the future, as your professionalism and reliability have made you a trusted partner. Thank you once again for your invaluable contribution. We look forward to strengthening our partnership ahead.

It has been a pleasure working with the IMARC team. The insights provided were structured, clear, and highly valuable, helping us strengthen both our technical and financial planning with confidence. We deeply appreciate the team’s professionalism, responsiveness, and attention to detail throughout the engagement. Every requirement was well understood and effectively incorporated, resulting in a comprehensive and actionable output. Overall, our experience has been excellent, and I would gladly recommend IMARC to organizations seeking a reliable research partner.

Your service is truly exceptional. Working with the IMARC team has been a seamless and professional experience. The clarity of communication, responsiveness to queries, and consistent support at every stage made the entire engagement highly efficient. The insights shared were well-structured, practical, and perfectly aligned with our requirements, helping us make informed decisions with confidence. Overall, the dedication and professionalism demonstrated by your team stand out, and I would be glad to recommend IMARC as a reliable and trustworthy research partner.

IMARC did an outstanding job in preparing our study. They were punctual, precise, and consistently responsive throughout the entire process. The team delivered all the data we required in a clear, well-organized, and highly professional format. Their strong attention to detail, combined with their ability to meet every deadline without compromising quality, truly set them apart. Overall, their reliability and commitment made them an exceptional partner for our project, and we would gladly work with them again in the future.

IMARC made the whole process incredibly easy from start to finish. Everyone I interacted with via email was polite, professional, and straightforward to deal with, always keeping their promises regarding delivery timelines and remaining consistently solutions-focused. From my very first contact, I appreciated the professionalism and support shown by the entire IMARC team. I highly recommend IMARC to anyone seeking timely, affordable, and reliable information or advice. My experience with IMARC was excellent, and I truly cannot fault any aspect of it.

I’d like to express my sincere gratitude for the excellent work you accomplished with the study. Your ability to quickly understand our requirements and deliver high-quality results under tight timelines truly reflects your expertise, exceptional work ethic, and unwavering commitment to your customer’s success. The professionalism and responsiveness you demonstrated throughout the process made a significant difference. Our entire team and company are incredibly thankful for your dedication, reliability, and support. Once again, thank you for your outstanding contribution.