Manufacturing
August 26 2026
How to Improve OEE in Manufacturing Plants in India: Reduce Downtime, Improve Performance, and Increase Output
Introduction
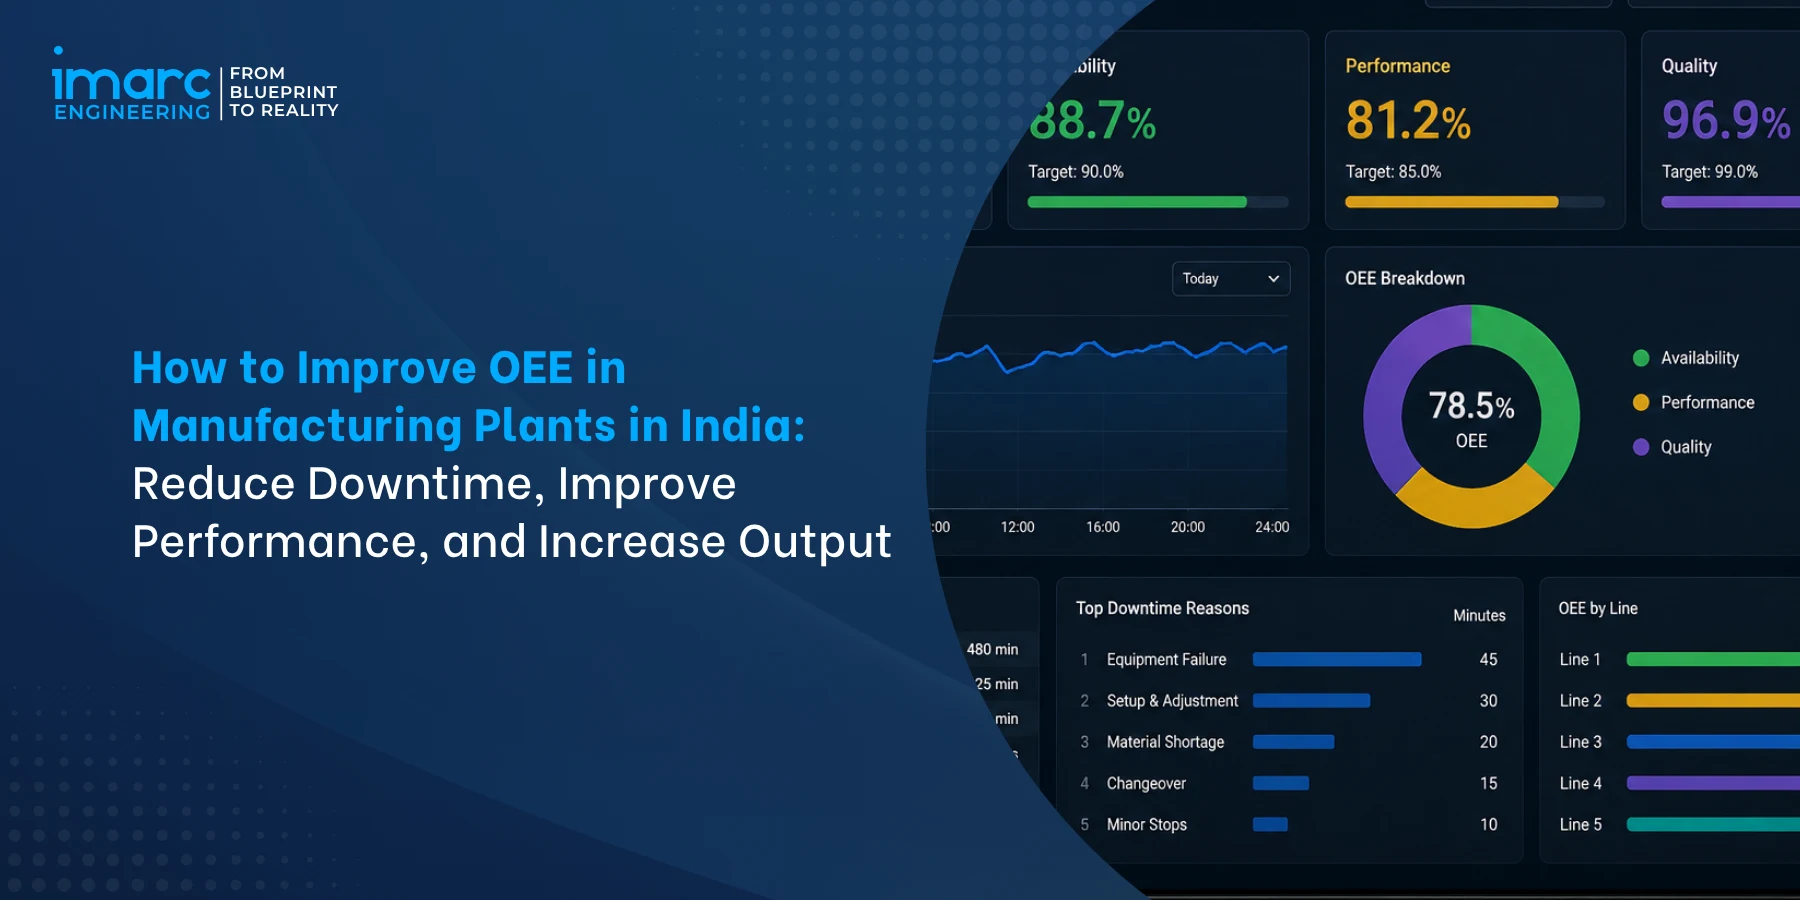
For plant leaders and operations heads managing production performance in Indian manufacturing facilities in 2026, understanding how to improve OEE in manufacturing represents one of the highest-leverage operational disciplines. Overall Equipment Effectiveness (OEE) is not merely a productivity KPI; it is a diagnostic framework for identifying and eliminating hidden capacity losses across Availability, Performance, and Quality dimensions.
Well-executed OEE improvement strategies frequently recover 10-30 percent of hidden equipment capacity without adding new machinery, transforming production economics for capacity-constrained operations.
Scope of this Guide
This guide answers the plant leader's question directly. How can manufacturers improve OEE by identifying and reducing availability, performance, and quality losses while increasing productive capacity from existing equipment? It walks through OEE fundamentals, loss diagnosis methodology, targeted improvement approaches across each loss category, OEE monitoring infrastructure, and roadmap prioritisation supporting sustained gains. The guide treats OEE as a decision-making framework rather than a scorecard, focusing on translating measurement into recoverable output that generic KPI tracking cannot achieve.
Table of Contents
- Introduction
- Why OEE Improvement Matters for Manufacturing Plants in India
- What OEE Is and How It Is Calculated in Manufacturing
- OEE Baseline and Loss Diagnosis for Manufacturing Plants in India
- Availability Loss Reduction and Downtime Elimination in Manufacturing
- Performance Loss and Cycle Time Improvement in Manufacturing
- Quality Loss and Defect Reduction for OEE Improvement
- OEE Monitoring and Data Infrastructure for Manufacturing Plants in India
- OEE Improvement Roadmap and Prioritisation for Manufacturers
- Conclusion
1. Why OEE Improvement Matters for Manufacturing Plants in India
Four drivers make disciplined OEE improvement a strategic priority for Indian manufacturing leaders in 2026.
1.1 Hidden Capacity Recovery Without New Investment
Manufacturing plants can lose productive capacity through breakdowns, changeovers, minor stops, reduced operating speeds, startup losses, defects, and rework. OEE helps quantify these losses and identify where recoverable capacity exists within current equipment.
For capacity-constrained operations, improving OEE at the true bottleneck can increase productive capability without immediately adding machinery. The achievable gain depends on baseline performance, the magnitude and recoverability of identified losses, and whether upstream, downstream, labour, material, or demand constraints limit additional output.
1.2 Rising Cost Pressure and Margin Discipline
Input cost pressure across raw materials, energy, labour, and logistics compresses manufacturing margins across sectors. Direct maintenance cost typically 3-8 percent of manufactured product cost with downtime cost often 3-5 times direct maintenance.
Reducing per-unit conversion cost through capacity utilisation improvement supports margin protection. Fixed cost absorption across higher productive output improves unit economics. Operational excellence increasingly distinguishes commercially sustainable manufacturers from those unable to compete on cost.
1.3 Energy Efficiency and PAT Scheme Alignment
Energy Conservation Act 2001 with Bureau of Energy Efficiency (BEE) Perform, Achieve and Trade (PAT) scheme creates measurable financial incentive for energy-intensive industries including iron and steel, cement, chemicals, textiles, aluminium, and thermal power.
OEE improvement can complement energy-efficiency programmes where reduced idling, repeated startups, rework, inefficient operating conditions, or equipment-related losses also contribute to unnecessary energy consumption. However, OEE and energy performance should be measured separately, since higher equipment effectiveness does not automatically guarantee lower energy consumption per unit.
1.4 Industry 4.0 Investment and Digital Foundation
SAMARTH Udyog Bharat 4.0 initiative under Department of Heavy Industries (DHI) supports smart manufacturing adoption across Indian industry. Industry 4.0 investment including sensors, connectivity, Manufacturing Execution Systems (MES), and analytics platforms requires baseline operational discipline for return realisation.
OEE measurement provides the foundational data infrastructure supporting Industry 4.0 investment. Digital manufacturing initiatives without underlying OEE discipline typically fail to deliver ROI, making OEE improvement prerequisite rather than parallel to digital investment.
2. What OEE Is and How It is Calculated in Manufacturing
Understanding what OEE is and how it is calculated in manufacturing provides the foundation for loss diagnosis rather than merely a scorecard exercise. OEE calculation in manufacturing combines three factors reflecting distinct loss categories.
2.1 The Three OEE Factors
| Factor | Definition | Example Losses |
|---|---|---|
| Availability | Run time as percentage of planned production time | Breakdowns, changeovers, setups, material shortage |
| Performance | Actual output speed as percentage of rated speed | Minor stops, reduced speed, idling |
| Quality | Good units as percentage of total units produced | Defects, rework, startup rejects, scrap |
2.2 OEE Calculation Method
OEE is calculated as Availability multiplied by Performance multiplied by Quality, expressed as a percentage. Availability equals Run Time divided by Planned Production Time. Performance equals (Ideal Cycle Time multiplied by Total Count) divided by Run Time.
Quality equals Good Count divided by Total Count. A plant operating at 90 percent Availability, 85 percent Performance, and 95 percent Quality would compute to OEE of 72.7 percent. The multiplication structure means that improving any single factor lifts the overall OEE proportionally while enabling clear identification of which factor most limits performance.
2.3 OEE Data Requirements
- Planned Production Time: scheduled operating time excluding planned non-production periods such as holidays, meetings, and planned downtime
- Run Time: actual operating time excluding all unplanned downtime and stoppages
- Ideal Cycle Time: theoretical minimum time to produce one unit at rated speed
- Total Count: total units produced during the run time
- Good Count: units meeting quality specifications on first pass without rework
- Downtime reason coding: categorised reasons for all stoppages supporting Pareto analysis
2.4 What OEE Does and Does Not Measure
OEE measures how effectively scheduled production time is converted into good units against theoretical potential. OEE does not directly measure total plant throughput, since demand and market constraints ultimately determine commercial output.
OEE improvement recovers capacity from existing equipment, but converting recovered capacity into commercial output requires demand availability, absence of upstream and downstream bottlenecks, and material and labour supporting incremental production. OEE serves as a diagnostic and improvement framework rather than standalone commercial performance metric.
3. OEE Baseline and Loss Diagnosis for Manufacturing Plants in India
OEE baseline and loss diagnosis for manufacturing plants in India establishes the factual foundation on which improvement decisions rest. Accurate OEE analysis typically reveals significant loss categories that intuitive assessment routinely underestimates.
3.1 Baseline Establishment Process
Baseline establishment progresses through defined stages. Scope selection covers a bottleneck machine, critical production line, or plant-level aggregate. Data collection typically runs 2-4 weeks capturing complete cycles including all shifts and product variants. Loss categorisation follows the Six Big Losses framework or Sixteen Losses framework depending on assessment depth.
Data verification through parallel observation and log reconciliation supports credibility. Baseline OEE calculation across the assessment period with loss breakdown by category. Baseline discipline prevents improvement initiatives targeting the wrong loss categories.
3.2 The Six Big Losses Framework
| Loss Category | OEE Factor | Typical Sources |
|---|---|---|
| Equipment breakdowns | Availability | Component failures, unplanned repairs |
| Setup and changeover | Availability | Product changes, tooling changes, cleaning |
| Minor stops | Performance | Jams, sensor errors, brief stoppages (<5 min) |
| Reduced speed | Performance | Running below rated speed |
| Startup rejects | Quality | Defects during initial run after startup |
| Production rejects | Quality | Defects during steady-state production |
3.3 Pareto Analysis and Root Cause Investigation
Pareto analysis identifies the vital few loss causes accounting for the majority of OEE gap. Typical patterns show 3-5 root causes accounting for 70-80 percent of losses across most plants. Root cause investigation using techniques including 5-Why analysis, Fishbone (Ishikawa) diagrams, Failure Mode and Effects Analysis (FMEA) per IEC 60812:2018, and detailed observation supports causal understanding versus symptomatic response.
Equipment breakdown analysis and Reliability Centred Maintenance (RCM) methodology per SAE JA1011 and JA1012 provide structured approaches for chronic breakdown reduction.
3.4 Loss Categorisation and Prioritisation
Loss categorisation into chronic (recurring, low individual impact but persistent) versus sporadic (occasional, high individual impact) supports differentiated response. Chronic losses typically respond to process discipline, standardisation, and preventive intervention. Sporadic losses typically require root cause elimination through engineering redesign or specification change.
Prioritisation combines loss magnitude, ease of correction, cost of intervention, and sustainability of improvement. High-magnitude easy-fix opportunities anchor initial improvement waves supporting momentum for subsequent complex work.
4. Availability Loss Reduction and Downtime Elimination in Manufacturing
Availability loss reduction and downtime elimination in manufacturing typically addresses the largest OEE improvement opportunity in Indian plants. Availability improvement combines maintenance excellence, changeover reduction, and material flow reliability.
4.1 Maintenance Excellence for Availability
- Preventive Maintenance (PM) scheduling based on operating hours or calendar cycles
- Predictive Maintenance using vibration analysis per ISO 20816 series, thermography, oil analysis, and motor circuit analysis
- Condition monitoring per ISO 17359:2018 supporting early defect detection and unplanned downtime reduction
- Reliability Centred Maintenance (RCM) per SAE JA1011/JA1012 optimising maintenance strategy per failure mode
- Total Productive Maintenance (TPM) covering autonomous maintenance by operators
- Reliability data collection per ISO 14224:2016 supporting maintenance decision-making
- Spare parts inventory optimisation balancing carrying cost versus stockout risk
4.2 Quick Changeover through SMED
Single-Minute Exchange of Die (SMED) methodology developed by Shigeo Shingo systematically reduces changeover time. SMED distinguishes internal changeover activities (requiring equipment shutdown) from external activities (performable while equipment operates).
Converting internal to external activities represents the primary reduction lever. Standardised procedures, pre-staged tooling, quick-connect fixtures, and organised changeover teams support execution. SMED implementation typically reduces changeover time by 50-90 percent enabling smaller batch sizes, reduced inventory, and higher Availability without capital investment.
4.3 Material and Support Flow Reliability
Material and support flow issues often cause preventable Availability losses. Raw material stockouts requiring production interruption. Consumables unavailability including packaging, labels, and process chemicals. Utility interruptions including power, water, compressed air, or steam. Operator availability during shift transitions or absence.
Quality inspection queue delays. Value Stream Mapping (VSM) identifies material and support flow constraints supporting systematic elimination. Kanban systems and cell-based layouts often improve material flow reliability substantially reducing peripheral downtime.
4.4 Breakdown Root Cause Elimination
Chronic breakdown patterns require root cause elimination rather than repeated repair. Common patterns include lubrication regime deficiencies, contamination pathways, vibration transmission from adjacent equipment, thermal cycling exceeding component tolerance, electrical transient exposure, and design margin erosion through operational stress.
Engineering interventions including component upgrades, protective barriers, redesigned interfaces, condition monitoring installation, and specification tightening address root causes. Investment in breakdown elimination typically pays back within 6-18 months through recovered production time.
5. Performance Loss and Cycle Time Improvement in Manufacturing
Performance loss and cycle time improvement in manufacturing often represents the most under-diagnosed OEE opportunity. Performance losses accumulate through small deviations across many cycles rather than through single dramatic events.
5.1 Minor Stop and Speed Loss Identification
Minor stops in manufacturing typically lasting under five minutes each often accumulate to substantial productive time loss. Sensor errors triggering brief stoppages. Product jams requiring quick clearance. Adjustment interventions for drift correction. Idle time between operations. Speed reductions from equipment condition or operator preference.
Detection requires precise cycle time monitoring rather than reliance on operator reporting which typically under-reports minor stops. Automatic data collection through equipment interfaces or manufacturing execution systems reveals patterns invisible to manual monitoring.
5.2 Cycle Time Analysis and Standardisation
Cycle time analysis compares actual production cycle against theoretical minimum. Cycle time recording across shifts, operators, and products identifies variation sources. Standardised Work definition establishing best-known method for each operation.
Training and coaching supporting standardised execution. Visual management showing cycle time performance in real time. Automatic cycle timing eliminating operator recording burden. Standardisation typically improves average cycle time 5-15 percent by reducing negative variation while providing baseline for further improvement.
5.3 Bottleneck Analysis and De-bottlenecking
Bottleneck analysis and recoverable capacity in manufacturing identifies the constraint operation determining overall line throughput. Theory of Constraints (TOC) methodology from Eli Goldratt focuses improvement on the bottleneck rather than local optimisations. Bottleneck OEE improvement translates directly to line-level throughput improvement.
Non-bottleneck OEE improvement recovers local capacity but does not increase line throughput unless bottleneck relief also occurs. De-bottlenecking approaches include cycle time reduction, parallel processing, buffer optimisation, and workflow redesign. Identifying the true bottleneck prevents wasteful non-bottleneck investment.
5.4 Equipment Condition and Performance Degradation
Progressive equipment condition degradation often reduces achievable running speed even when equipment nominally functions. Wear on cutting tools, packing seals, drive belts, or bearings reducing rated performance. Contamination reducing sensor sensitivity or fluid flow. Alignment drift affecting precision operations. Vibration transmission from ageing bearings.
Condition monitoring supporting proactive intervention before performance loss becomes visible. Refurbishment or component replacement restoring rated performance capability. Performance degradation identification distinguishes equipment performance improvement needs arising from equipment condition issues versus those arising from operational practice issues.
6. Quality Loss and Defect Reduction for OEE Improvement
Quality loss and defect reduction for OEE improvement addresses both direct scrap and rework loss and indirect impact on Availability and Performance through quality-related interruptions and adjustments.
6.1 Quality Loss Categories and Direct OEE Impact
Quality losses categorised as startup rejects (defects during initial run after startup or changeover), production rejects (defects during steady-state production), and rework (units requiring corrective processing before acceptance). Each defective unit reduces the Quality OEE factor proportionally. Startup rejects typically address through reduced changeover frequency, improved setup procedures, and first-piece inspection discipline.
Production rejects address through process capability improvement, tighter control parameters, and root cause elimination of defect sources. Rework addresses through defect prevention rather than efficient rework processing.
6.2 Process Capability and Statistical Process Control
Process capability studies quantify whether the manufacturing process can reliably produce within specification. Process Capability Index (Cpk) above 1.33 indicates capable process; below 1.0 indicates process incapable of consistent conformance. Statistical Process Control (SPC) charts monitor process parameters supporting early detection of drift toward specification limits.
Control chart discipline distinguishes special-cause variation requiring investigation from common-cause variation reflecting normal process behaviour. Process capability foundation supports systematic quality improvement that reactive inspection alone cannot achieve.
6.3 Defect Root Cause Analysis
- 5-Why analysis systematically probing defect origins through successive causal questions
- Fishbone (Ishikawa) diagrams organising causes across Man, Machine, Method, Material, Measurement, Environment
- Failure Mode and Effects Analysis (FMEA) per IEC 60812:2018 for critical defect modes
- Design of Experiments (DOE) for multi-factor process optimisation
- Poka-yoke (mistake-proofing) designs preventing defects at source
- Six Sigma DMAIC methodology (Define, Measure, Analyse, Improve, Control) for systematic defect reduction
- Lean quality tools including standardised work, visual controls, and first-piece inspection
6.4 Indirect Quality Impact on OEE
Quality issues indirectly reduce Availability and Performance beyond the direct Quality factor impact. Frequent quality adjustments interrupting production reducing Availability. Reduced running speed to protect quality reducing Performance. Extended startup after quality-related stoppage reducing Availability.
Buffer stock accumulation for quality-affected products creating downstream disruption. Comprehensive quality improvement typically delivers OEE improvement significantly larger than direct Quality factor gains alone, reflecting the interconnected nature of the three OEE factors.
7. OEE Monitoring and Data Infrastructure for Manufacturing Plants in India
OEE monitoring and data infrastructure for manufacturing plants in India enables sustained improvement rather than one-time gains. Data infrastructure quality determines whether OEE improvement momentum persists beyond initial focused campaigns.
7.1 Manual Versus Automated Data Collection
Manual OEE data collection through operator logs, downtime registers, and shift reports supports initial baseline establishment but typically fails to sustain improvement momentum. Operator burden reduces reporting quality over time. Minor stops routinely under-reported by 30-70 percent in manual systems. Timing precision limited to observable events.
Automated data collection through equipment interfaces, sensors, and Manufacturing Execution Systems (MES) provides objective real-time measurement supporting sustained OEE discipline. Investment in automated data collection typically pays back within 6-12 months through improved decision-making quality.
7.2 Manufacturing Execution System (MES) and OEE Platforms
Manufacturing Execution System (MES) platforms provide integrated production monitoring including OEE calculation, downtime tracking, quality logging, and performance reporting. Purpose-built OEE platforms including cloud-based solutions provide focused OEE functionality with lower implementation complexity.
Enterprise platforms including SAP Manufacturing Execution, Rockwell FactoryTalk, GE Proficy, Siemens Opcenter, and others support integrated manufacturing operations management. Selection considers scale, complexity, integration requirements, and Industry 4.0 roadmap. Platform selection matched to operational maturity supports both current needs and future evolution.
7.3 Real-Time Visibility and Response
Real-time OEE visibility through shopfloor displays, mobile applications, and management dashboards transforms OEE from retrospective reporting into operational response tool. Andon systems supporting immediate escalation of stoppages. Shift-level review meetings using real-time data supporting rapid intervention.
Weekly and monthly review supporting trend analysis and improvement initiative tracking. Executive dashboards supporting strategic decision-making. Visibility architecture matched to organisational levels supports both operational response and strategic oversight that isolated reporting cannot achieve.
7.4 KPI Framework and ISO 22400 Alignment
International standard ISO 22400-2:2014 covering Manufacturing Operations Management Key Performance Indicators provides standardised OEE definition supporting consistent measurement. Complementary KPIs including Total Effective Equipment Performance (TEEP), Overall Operations Effectiveness (OOE), Mean Time Between Failures (MTBF), Mean Time To Repair (MTTR), and First Pass Yield (FPY) support integrated performance measurement.
Standardised KPI framework supports both internal comparison across shifts and periods and external benchmarking against industry data. KPI discipline distinguishes improvement based on measured reality from initiative based on subjective assessment.
8. OEE Improvement Roadmap and Prioritisation for Manufacturers
OEE improvement roadmap and prioritisation for manufacturers translates diagnosis into sustained execution. Roadmap discipline supports momentum across multi-year improvement journeys that unstructured initiatives typically cannot sustain.
8.1 Improvement Wave Structure
| Wave | Focus | Typical Duration |
|---|---|---|
| Wave 1: Diagnosis and quick wins | Baseline, Pareto losses, low-hanging fruit | 3-6 months |
| Wave 2: Availability improvement | PM, SMED, breakdown elimination | 6-12 months |
| Wave 3: Performance improvement | Cycle time, minor stops, standardisation | 6-12 months |
| Wave 4: Quality improvement | Process capability, defect elimination | 6-12 months |
| Wave 5: Sustainment | Systems, culture, continuous improvement | Ongoing |
8.2 Prioritisation Framework
- Loss magnitude: Pareto ranking of losses by impact on OEE
- Ease of correction: technical complexity and organisational change requirement
- Investment requirement: capital cost versus expected return
- Time to impact: quick wins versus long-cycle initiatives
- Sustainability: process changes versus one-time interventions
- Bottleneck focus: initiatives on constraint operations versus non-bottleneck local gains
- Organisational readiness: capability, capacity, and change tolerance
8.3 Governance and Sustainment
Improvement governance supports momentum across the multi-year OEE journey toward measurable production output improvement. Executive sponsorship providing organisational priority and resource commitment. Steering committee reviewing progress and removing obstacles. Improvement teams focused on specific loss categories or areas.
Kaizen event framework for focused rapid-improvement sessions. Standardised improvement methodology (typically Lean Six Sigma DMAIC) supporting consistent execution. Success celebration and recognition sustaining engagement. Sustainment mechanisms including standard operating procedures, control plans, and audit programmes preventing regression. Governance discipline distinguishes durable improvement from one-time gains that typically erode.
Conclusion
OEE improvement helps Indian manufacturers recover capacity through disciplined measurement, Six Big Losses analysis, Pareto prioritisation, maintenance, SMED, cycle-time optimisation, bottleneck reduction, quality improvement, and structured monitoring. A phased roadmap and governance framework help convert these gains into sustained operational performance.
Plant leaders should avoid universal OEE targets. The commonly cited 85% benchmark varies by industry and process. OEE gains also require demand, materials, labour, and downstream capacity. Sustained improvement depends on reliable data, real-time visibility, standardised methods, and ongoing governance.
PURSUING OEE IMPROVEMENT?
IMARC Engineering's OEE improvement and manufacturing performance advisory team supports plant leaders, operations heads, and manufacturing excellence teams across OEE baseline establishment through data collection, verification, and loss categorisation per Six Big Losses framework, loss diagnosis using Pareto analysis, 5-Why methodology, Fishbone (Ishikawa) diagrams, and Failure Mode and Effects Analysis (FMEA) per IEC 60812:2018, availability improvement covering Preventive Maintenance scheduling, Predictive Maintenance through vibration analysis per ISO 20816 series, thermography, oil analysis, and motor circuit analysis, Reliability Centred Maintenance per SAE JA1011 and JA1012, Total Productive Maintenance (TPM), Single-Minute Exchange of Die (SMED) changeover reduction, reliability data collection per ISO 14224:2016, and spare parts optimisation, performance improvement covering cycle time analysis and standardisation, minor stop root cause elimination, multi-wave roadmap development and prioritisation, improvement governance including executive sponsorship and steering committee structures, Kaizen event facilitation, capability development supporting sustainment, and disciplined execution across multi-year improvement programmes for OEE improvement across manufacturing plants in India.
→ Schedule a free OEE improvement scoping consultation with an IMARC specialist
Frequently Asked Questions
Overall Equipment Effectiveness (OEE) measures manufacturing productivity as a percentage combining Availability (uptime as percentage of scheduled time), Performance (actual output speed versus rated speed), and Quality (good units as percentage of total produced). The three components multiplied together give the final OEE score.
OEE improvement strategies systematically address availability, performance, and quality losses separately. Availability improves through preventive maintenance, quick changeovers, and breakdown reduction. Performance improves through cycle time optimisation and minor stop elimination. Quality improves through defect root cause analysis and process control tightening.
Low OEE in manufacturing plants typically results from unplanned equipment breakdowns, long changeover times, minor stops, reduced operating speed, defects requiring rework or scrap, planned maintenance during production windows, material shortages, operator absence, and quality issues. Root cause analysis distinguishes chronic versus sporadic patterns.
Manufacturers reduce manufacturing downtime through preventive maintenance scheduling, predictive maintenance using condition monitoring, reliability-centred maintenance methodology, quick changeover programmes (SMED), standardised operating procedures, spare parts inventory optimisation, operator training on first-line maintenance, and root cause elimination of recurring breakdowns following Pareto analysis of downtime causes.
Performance losses reduce through cycle time analysis identifying deviation from rated speed, minor stop root cause elimination, operator technique standardisation, tool and fixture optimisation, material flow improvement, bottleneck identification and de-bottlenecking, and equipment condition improvement addressing wear-based speed degradation over asset life.
Quality losses reduce OEE proportionally - if 5 percent of units are defective, the Quality factor drops to 95 percent multiplying the overall OEE. Defects also indirectly reduce Performance through rework time and Availability through equipment adjustments needed for quality corrections during production.
There is no universally applicable OEE benchmark. While 85 percent is often cited as world-class for discrete manufacturing, achievable OEE varies substantially by industry, process type (batch versus continuous), product complexity, and equipment age. Meaningful improvement targets should reference the plant's own baseline.
OEE improvement recovers hidden capacity from existing equipment. Each percentage point of OEE gain translates to proportional productive time recovery. However, actual output increase depends on market demand, upstream/downstream constraints, or other production bottlenecks limiting the ability to convert recovered equipment capacity into commercial output.
Recent Post




Trusted by Industry Leaders
We partner with global enterprises and ambitious businesses across sectors to deliver operational excellence, strategic insights, and sustainable growth through integrated solutions.












Success in Their Words
Real feedback from clients across industries. Discover how our solutions delivered measurable impact and operational excellence.

I wanted to express my sincere appreciation for your efforts in handling this matter. Your dedication and commitment have been truly commendable, and it is evident that you have put in tremendous hard work and expertise into resolving the issues at hand. We are greatly interested in continuing our collaboration with you in the future, as your professionalism and reliability have made you a trusted partner. Thank you once again for your invaluable contribution. We look forward to strengthening our partnership ahead.

It has been a pleasure working with the IMARC team. The insights provided were structured, clear, and highly valuable, helping us strengthen both our technical and financial planning with confidence. We deeply appreciate the team’s professionalism, responsiveness, and attention to detail throughout the engagement. Every requirement was well understood and effectively incorporated, resulting in a comprehensive and actionable output. Overall, our experience has been excellent, and I would gladly recommend IMARC to organizations seeking a reliable research partner.

Your service is truly exceptional. Working with the IMARC team has been a seamless and professional experience. The clarity of communication, responsiveness to queries, and consistent support at every stage made the entire engagement highly efficient. The insights shared were well-structured, practical, and perfectly aligned with our requirements, helping us make informed decisions with confidence. Overall, the dedication and professionalism demonstrated by your team stand out, and I would be glad to recommend IMARC as a reliable and trustworthy research partner.

IMARC did an outstanding job in preparing our study. They were punctual, precise, and consistently responsive throughout the entire process. The team delivered all the data we required in a clear, well-organized, and highly professional format. Their strong attention to detail, combined with their ability to meet every deadline without compromising quality, truly set them apart. Overall, their reliability and commitment made them an exceptional partner for our project, and we would gladly work with them again in the future.

IMARC made the whole process incredibly easy from start to finish. Everyone I interacted with via email was polite, professional, and straightforward to deal with, always keeping their promises regarding delivery timelines and remaining consistently solutions-focused. From my very first contact, I appreciated the professionalism and support shown by the entire IMARC team. I highly recommend IMARC to anyone seeking timely, affordable, and reliable information or advice. My experience with IMARC was excellent, and I truly cannot fault any aspect of it.

I’d like to express my sincere gratitude for the excellent work you accomplished with the study. Your ability to quickly understand our requirements and deliver high-quality results under tight timelines truly reflects your expertise, exceptional work ethic, and unwavering commitment to your customer’s success. The professionalism and responsiveness you demonstrated throughout the process made a significant difference. Our entire team and company are incredibly thankful for your dedication, reliability, and support. Once again, thank you for your outstanding contribution.