Maufacturing
July 22 2026
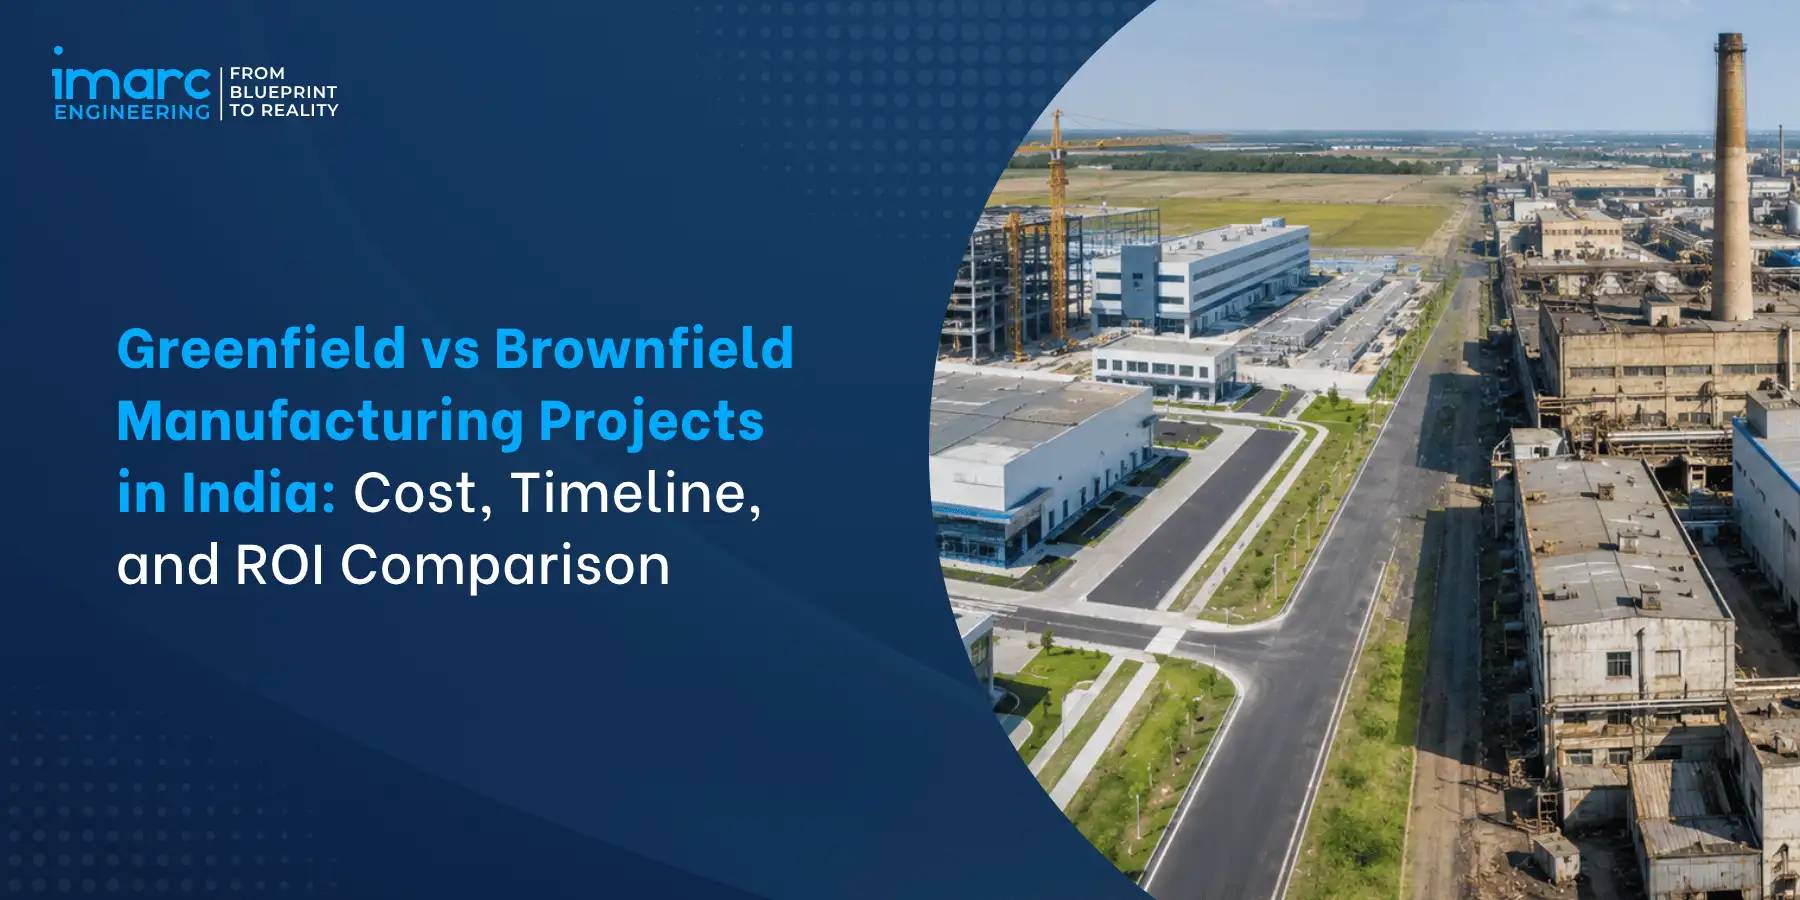
Greenfield vs Brownfield Manufacturing Projects in India: Cost, Timeline, and ROI Comparison
Introduction
For any promoter or investor planning a new manufacturing facility or capacity expansion in India, the choice between greenfield vs brownfield manufacturing projects in India shapes almost every downstream decision, investment size, timeline to production, regulatory pathway, operational risk, and long-term return on capital. Neither approach is universally superior. Each suits specific project objectives, capacity requirements, product portfolios, and organisational contexts.
The Scope of this Guide
This guide answers the manufacturers project-choice question directly. How do greenfield manufacturing project and brownfield manufacturing project options compare on investment cost, project timeline, regulatory requirements, operational risks, infrastructure availability, and return on investment? It walks through structured definitions, side-by-side comparison, cost and timeline benchmarks, risk profiles, ROI patterns, sector-specific fit, and the practices that make each pathway succeed for the right project.
Table of Contents
- Introduction
- What is a Greenfield Manufacturing Project?
- What is a Brownfield Manufacturing Project?
- Greenfield vs Brownfield: Side-by-Side Comparison
- Cost Comparison
- Timeline Comparison
- Regulatory Approval Comparison
- Infrastructure and Utilities
- Operational Risk Assessment
- Expansion and Scalability
- ROI Considerations
- Which Option Is Best for Different Industries?
- How IMARC Engineering Supports Greenfield and Brownfield Projects
- Conclusion
1. What is a Greenfield Manufacturing Project?
A greenfield manufacturing project is a new manufacturing facility developed on previously undeveloped land or a site without existing operations. The investor exercises complete design freedom — site selection, plant layout, process flow, utility infrastructure, technology choice, and workforce composition are all planned from a clean slate without legacy constraints.
1.1 Characteristics of Greenfield Projects
- New site development on undeveloped or industrial estate land
- Full design freedom for optimised layout and technology
- All utility infrastructure built from scratch
- Complete set of regulatory approvals required
- Workforce recruitment and training from base
- Higher initial capex; longer time to first production
- Lower operational risk from legacy issues; higher ramp-up risk
1.2 When Greenfield Makes Sense
Greenfield projects suit new product categories requiring specific facility characteristics, capacity requirements exceeding brownfield expansion feasibility, strategic geographic diversification, PLI-linked capacity commitments requiring dedicated facilities, technology transformations incompatible with existing operations, and long-horizon investments where full design freedom justifies the higher upfront cost.
Automotive OEMs launching new platforms, pharmaceutical manufacturers introducing sterile injectables, semiconductor fabrication, and other technology-defining projects typically require greenfield development.
2. What is a Brownfield Manufacturing Project?
A brownfield manufacturing project involves expansion, modernisation, or reconstruction of an existing manufacturing facility. The project developer leverages existing land, utility connections, regulatory approvals, and workforce while adapting to legacy constraints. Brownfield projects range from equipment replacement and plant modernization through incremental capacity expansion to substantial reconstruction.
2.1 Characteristics of Brownfield Projects
- Development within or adjacent to existing facility
- Leverages existing land, utilities, approvals, and workforce
- Constrained by legacy layout, infrastructure, and operations
- Amendment-based regulatory pathway typically applicable
- Existing workforce augmented rather than newly recruited
- Lower capex per unit of capacity; faster time to production
- Higher operational risk from live-site construction; lower ramp-up risk
2.2 When Brownfield Makes Sense
Brownfield projects suit capacity expansion within existing product portfolio, manufacturing plant expansion for growing demand, technology upgrades within compatible operational envelope, incremental automation and digitisation, PLI capacity ramp-up when existing operations already qualify, and product line additions compatible with existing utilities and approvals.
Factory expansion in India through brownfield development often delivers 40-70 percent of equivalent capacity at 40-70 percent of greenfield capex with materially shorter timelines.
3. Greenfield vs Brownfield: Side-by-Side Comparison
The following comparison highlights the key differences between greenfield and brownfield manufacturing projects across the factors that most influence investment and project planning decisions. Neither option is universally better; the right choice depends on project objectives, business priorities, and project constraints.
| Dimension | Greenfield | Brownfield |
|---|---|---|
| Site Development | New land, full infrastructure | Existing site, incremental changes |
| Design Freedom | Complete freedom | Constrained by legacy |
| Capex per Unit Capacity | Higher (100 percent baseline) | Lower (40-70 percent of greenfield) |
| Timeline to Production | 18-36 months typical | 9-18 months typical |
| Regulatory Approvals | Full new approvals required | Amendments typically applicable |
| Utility Infrastructure | Full bringing required | Leverages existing |
| Workforce | Fresh recruitment and training | Existing team augmented |
| Live-Site Risk | None during construction | Ongoing operations must continue |
| Ramp-Up Risk | Higher (new operations) | Lower (proven operations) |
| ROI (typical range) | 15-25 percent IRR | 20-35 percent IRR |
4. Cost Comparison
Understanding the cost and timeline differences between greenfield and brownfield manufacturing projects requires a structured CAPEX comparison across major cost heads. Both approaches share equipment costs but diverge substantially on land, infrastructure, and contingency.
4.1 Capex Component Breakdown
| Cost Head | Greenfield (share of capex) | Brownfield (share of capex) |
|---|---|---|
| Land Acquisition | 5-15 percent | 0 percent (existing) |
| Site Development | 3-8 percent | 1-3 percent |
| Utility Bringing | 10-20 percent | 3-8 percent |
| Buildings | 15-25 percent | 10-18 percent |
| Equipment | 30-45 percent | 40-55 percent |
| Contingency | 8-12 percent | 10-15 percent |
| Pre-operative and Working Capital | 5-10 percent | 5-10 percent |
4.2 Total Capex Ranges
Greenfield capex depends heavily on scale and sector. Small-scale greenfield facilities may require INR 25-100 crore. Medium-scale greenfield facilities typically range INR 100 crore - 1,000 crore. Large integrated greenfield facilities can exceed INR 1,000-5,000 crore particularly in automotive, pharmaceuticals, semiconductors, and heavy engineering.
Brownfield projects delivering equivalent incremental capacity typically require 40-70 percent of greenfield investment. Sector-specific benchmarks and quality-of-existing-infrastructure materially affect actual ratios.
4.3 Cost Uncertainty and Contingency
Cost uncertainty patterns differ. Greenfield projects face uncertain site conditions, unknown subsurface issues, and infrastructure bringing surprises but benefit from clean-slate planning. Brownfield projects face uncertain hidden site conditions (contamination, asbestos, structural degradation, obsolete utility networks) and integration surprises between old and new.
Brownfield contingency requirements are typically 200-500 basis points higher than greenfield reflecting these hidden risks. Structured pre-project surveys reduce but do not eliminate contingency requirements.
5. Timeline Comparison
Structured project timeline comparison distinguishes the phase-level differences that shape business decisions. Greenfield projects typically require 18-36 months from concept to commercial production; brownfield equivalents typically run 9-18 months. Complex greenfield projects (semiconductors, integrated automotive, pharmaceutical sterile) may extend to 36-60 months.
5.1 Phase-Level Timeline Breakdown
| Project Phase | Greenfield Duration | Brownfield Duration |
|---|---|---|
| Feasibility and Planning | 3-6 months | 2-4 months |
| Land Acquisition and Diligence | 3-9 months | Not applicable |
| Regulatory Approvals | 6-18 months | 3-9 months |
| Detailed Engineering | 4-8 months | 3-6 months |
| Construction and Installation | 12-24 months | 6-14 months |
| Commissioning and Ramp-Up | 3-6 months | 2-4 months |
5.2 Critical Path Considerations
Critical path drivers differ between the two approaches. Greenfield critical paths often run through land acquisition, Environmental Clearance under EIA Notification 2006 (typically 12-18 months), or long-lead equipment procurement. Brownfield critical paths often run through utility augmentation, live-site construction sequencing to maintain operations, and regulatory amendments. Structured critical path management with early risk identification materially compresses actual timelines from typical to best-in-class.
5.3 Parallel Workstream Opportunities
Both project types benefit from parallel workstream management. Detailed engineering, regulatory approvals, and long-lead equipment procurement should run parallel rather than sequential. Brownfield projects offer additional parallelisation opportunities through progressive commissioning of new sections while old sections continue operating. Structured project scheduling using critical path methodology combined with resource-constrained scheduling delivers timeline compression that sequential planning cannot achieve.
6. Regulatory Approval Comparison
Regulatory approvals for greenfield vs brownfield projects follow the same statutory framework but differ substantially in pathway. Greenfield projects require full new approvals; brownfield projects typically operate through amendments to existing approvals.
6.1 Approval Framework
| Approval | Greenfield | Brownfield |
|---|---|---|
| Environmental Clearance (EIA 2006) | Full EC required (12-18 months) | Amendment or expansion EC (6-12 months) |
| Consent to Establish (CTE) | Full CTE from SPCB | Amendment to existing CTE |
| Consent to Operate (CTO) | Full CTO pre-commissioning | Amendment to existing CTO |
| Change of Land Use (CLU) | Often required | Rarely required |
| Factory Licence (OSH Code 2020) | Full new licence | Amendment to existing licence |
| Fire NOC | Full new NOC | Amendment or fresh NOC |
| Building Permission | Full permission required | Building addition permission |
| Sector-Specific Approvals | Full (CDSCO, FSSAI, ARAI, etc.) | Product or capacity endorsement |
6.2 Approval Timeline Impact
Approval timelines materially affect overall project schedules. Environmental Clearance is often the longest single approval and frequently the critical path for greenfield projects. Amendment-based approvals for brownfield projects typically compress this timeline by 40-60 percent.
State-specific procedural variations affect timelines both ways. Structured approval sequencing with parallel initiation prevents approvals from becoming avoidable critical-path constraints.
6.3 Common Approval Pitfalls
Common approval pitfalls include incomplete documentation causing multiple re-submissions, poorly scoped Environmental Impact Assessment producing rejection or major modifications, unclear zoning validation delaying Change of Land Use, weak Fire NOC preparation causing multiple deficiency cycles, and sector-specific approvals discovered late in the project. Structured approval planning at project outset materially reduces these risks.
7. Infrastructure and Utilities
Infrastructure and utilities comparison on greenfield vs brownfield highlights one of the largest differentiators between the two approaches. Greenfield projects build utility infrastructure from scratch; brownfield projects leverage existing infrastructure with incremental augmentation.
7.1 Power Supply
Greenfield projects require complete grid connectivity including HT power connection (11kV to 132kV depending on load), substation development, feeder lines, and backup power infrastructure. Brownfield projects typically augment existing supply through feeder capacity upgrade, additional transformers within existing HT infrastructure, or renewable energy integration. Power infrastructure cost as share of project capex is typically 2-6 percent for greenfield versus 0.5-2 percent for brownfield augmentation.
7.2 Water, Gas, and Wastewater
Water supply for greenfield projects includes source development (municipal, groundwater with CGWA NOC, or surface), storage, treatment, and internal distribution. Brownfield projects expand existing storage and treatment.
Natural gas connection through GAIL or state gas company requires full connection for greenfield versus flow capacity augmentation for brownfield. Wastewater management requires new effluent treatment for greenfield versus expansion of existing infrastructure for brownfield. Common Effluent Treatment Plants (CETPs) in industrial estates simplify both scenarios.
7.3 Roads, Connectivity, and Ancillary Infrastructure
Ancillary infrastructure differs materially. Greenfield projects require boundary walls, internal roads, drainage, storm water management, fibre optic connectivity, security infrastructure, canteen and welfare facilities, parking, and administrative buildings.
Brownfield projects leverage most of this existing infrastructure with incremental modifications. Overall infrastructure share of greenfield capex typically runs 20-35 percent versus 5-15 percent for brownfield.
8. Operational Risk Assessment
Operational risk assessment for manufacturing projects reveals distinctly different risk profiles between the two approaches. Structured industrial project management must address the specific risks each pathway presents.
8.1 Greenfield-Specific Risks
- Land title disputes surfacing post-purchase
- Approval delays extending timelines by 6-18 months
- Utility bringing cost overruns from unknown site conditions
- Construction risks including monsoon delays, labour disputes
- Ramp-up challenges as new workforce learns operations
- Supply chain and vendor development from base
- Market validation risk if capacity precedes demand certainty
8.2 Brownfield-Specific Risks
- Interference with ongoing operations during construction
- Hidden legacy issues including asbestos, contamination, structural degradation
- Integration challenges between old and new infrastructure
- Employee and change management as roles evolve
- Quality risk from mixed old-new operations during transition
- Amendment approvals delayed by legacy compliance issues
- Constrained execution windows during plant shutdowns
8.3 Risk Mitigation Strategies
Structured risk mitigation applies to both approaches. Comprehensive pre-project surveys (land title, geotechnical, environmental, structural, utility infrastructure) surface risks before commitment. Contingency budgets sized appropriately for the risk profile. Insurance including construction all-risk, third-party liability, and delay-in-startup cover key exposures.
Structured project management with defined risk registers, mitigation actions, and escalation protocols. For brownfield specifically, phased execution plans that maintain operations while enabling construction, structured shutdown windows for critical work, and change management for affected employees.
9. Expansion and Scalability
Expansion and scalability potential differs materially between greenfield and brownfield approaches. This dimension often gets underweighted in initial evaluations but materially affects long-term returns.
9.1 Greenfield Scalability Advantages
Greenfield projects offer inherent scalability advantages through provisioning for future expansion at initial design stage. Land banking typically provisions 50-100 percent of initial requirement for future growth. Utility infrastructure sized at 110-125 percent of initial demand accommodates expansion without retrofit. Modular plant design supports staged capacity additions.
Boundary wall alignment permits contiguous expansion. Structured greenfield planning typically supports 2-3 rounds of expansion before running into hard constraints.
9.2 Brownfield Scalability Constraints
Brownfield projects face inherent scalability constraints. Available land typically limits expansion potential. Existing utility infrastructure may require substantial upgrade for further growth. Constrained layouts limit optimisation. Neighbouring facilities or urban encroachment may block further expansion.
Environmental Clearance capacity limits require formal expansion processes. Brownfield expansions typically support 1-2 rounds before requiring greenfield relocation or major reconstruction.
9.3 Long-Horizon Strategic Considerations
Long-horizon strategic considerations often favour greenfield despite higher initial capex. Manufacturers pursuing 20-30 year operational horizons with substantial capacity growth typically find that greenfield land provisioning and infrastructure sizing pay back through multiple expansion rounds.
Manufacturers pursuing shorter horizons or facing capacity uncertainty often find brownfield's lower initial commitment and faster payback more attractive. Strategic horizon should shape the choice as materially as immediate financials.
10. ROI Considerations
ROI comparison greenfield vs brownfield typically favours brownfield in isolated financial analysis. Structured manufacturing ROI evaluation must consider both direct returns and strategic optionality.
10.1 Typical ROI Ranges
| Metric | Greenfield | Brownfield |
|---|---|---|
| Typical IRR | 15-25 percent | 20-35 percent |
| Payback Period | 4-7 years | 2.5-5 years |
| Time to First Cash Flow | 24-42 months | 12-24 months |
| NPV Sensitivity | Higher variability | More predictable |
| Strategic Optionality Premium | High | Moderate |
10.2 Direct Financial Comparison
Brownfield projects typically deliver superior direct financial returns through lower capex (40-70 percent of greenfield for equivalent incremental capacity), faster time to cash flow, and lower ramp-up cost. IRR improvement of 500-1,000 basis points is typical when brownfield is feasible.
Payback compression from 4-7 years to 2.5-5 years materially improves financial metrics. Structured brownfield execution requires only 12-24 months to first cash flow versus 24-42 months for greenfield.
10.3 Strategic Value and Optionality
Strategic value considerations often justify greenfield despite weaker headline financials. New geographic markets require physical presence. New product categories may need dedicated facilities. Long-horizon growth trajectories benefit from expansion runway. Technology-defining projects (semiconductors, EV batteries, biosimilars) often require greenfield to build technology moats.
PLI capacity commitments in some sectors require dedicated new facilities. Structured evaluation weighs both direct financial returns and strategic optionality rather than optimising on financial metrics alone.
11. Which Option is Best for Different Industries?
Sector-specific greenfield brownfield choice patterns emerge from combining sector economics, regulatory characteristics, and typical project objectives. The following patterns reflect common industry practice.
| Sector | Greenfield Fit | Brownfield Fit |
|---|---|---|
| Automotive OEM | New platform, new geography | Model changes, capacity expansion |
| Automotive Components | New OEM alignment, new tech | Capacity expansion, automation |
| Pharmaceuticals (Formulations) | New dosage forms, sterile | Capacity in existing forms |
| Pharmaceuticals (API) | New molecule categories | Capacity for existing molecules |
| Semiconductors and Electronics | Almost always greenfield | Testing/packaging, incremental |
| Food and Beverage | New categories, geography | Capacity, packaging line addition |
| Textiles and Apparel | New geography, fibre types | Automation, capacity, modernisation |
| Chemicals | New hazard categories | Capacity within existing safety envelope |
| Heavy Engineering / Machinery | Major expansion, new products | Existing facility augmentation |
| FMCG and Consumer Goods | New categories | Line additions, automation |
11.1 Sector Decision Drivers
Sector decision drivers include regulatory complexity (higher for pharma, chemicals, semiconductors, favouring greenfield for new categories), technology change velocity (higher favouring greenfield for new tech), capacity granularity (finer granularity favouring brownfield expansion), and buyer expectation (some OEMs prefer dedicated facilities favouring greenfield). Structured sector-informed evaluation typically produces clearer decisions than generic financial analysis.
12. How IMARC Engineering Supports Greenfield and Brownfield Projects
IMARC Engineering's advisory offering supports manufacturers, investors, and project developers across both greenfield and brownfield project pathways through structured project development and engineering advisory services.
12.1 Greenfield Project Support
Greenfield engagements typically cover project feasibility studies, site selection and due diligence, land and infrastructure evaluation, regulatory pathway design, master planning, detailed engineering coordination, technology partner selection, contractor evaluation, project management, statutory approvals coordination, construction supervision, commissioning support, and ramp-up advisory. Structured greenfield engagements typically extend 18-42 months from feasibility to commercial operations.
12.2 Brownfield Project Support
Brownfield engagements typically cover expansion feasibility assessment, existing facility audit including structural, utility, and process capacity, gap analysis against expansion requirements, phased execution planning to maintain operations, regulatory amendment coordination, utility augmentation design, live-site construction sequencing, integration engineering, change management for affected employees, and progressive commissioning of new capacity. Structured brownfield engagements typically extend 9-24 months from feasibility to expanded operations.
12.3 Common Advisory Elements
Common advisory elements across both project types include capex estimation and contingency planning, project scheduling and critical path management, risk register development and mitigation, insurance structuring, regulatory approval planning, contractor and vendor evaluation, and progress monitoring. Structured advisory materially reduces the schedule and budget variance that unstructured project execution routinely produces.
Conclusion
Choosing between a greenfield and brownfield manufacturing project is one of the most important strategic decisions in industrial project development. The right choice depends on balancing investment, execution speed, regulatory complexity, infrastructure availability, operational continuity, scalability, and long-term business objectives rather than focusing on a single metric such as CAPEX or ROI.
Greenfield projects provide complete design flexibility, greater scalability, and long-term strategic advantages, making them well suited for new product categories, large-scale manufacturing facilities, and long-term expansion plans. Brownfield projects offer lower capital investment, faster time to production, and better utilisation of existing infrastructure and workforce, making them an attractive option for manufacturers seeking capacity expansion, plant modernisation, or incremental growth.
Rather than defaulting to a familiar approach, manufacturers should evaluate both pathways against their project objectives, industry requirements, existing infrastructure, investment capacity, regulatory obligations, and long-term growth strategy. A structured comparison of cost, project timeline, approval requirements, operational risks, infrastructure readiness, and expected return on investment enables better-informed project decisions and reduces execution risk.
Engaging experienced engineering and project advisory support during the early planning stage can further strengthen project outcomes by identifying potential risks, evaluating technical and financial feasibility, optimising project execution strategies, and ensuring regulatory readiness. Since the decision between a greenfield and brownfield project shapes the entire project lifecycle, making the right choice at the outset is critical to achieving both operational success and long-term business value.
PLANNING YOUR GREENFIELD OR BROWNFIELD PROJECT?
IMARC Engineering's greenfield and brownfield manufacturing project advisory team supports sponsors, investors, and project development leaders across pathway evaluation, feasibility studies, site selection and due diligence for greenfield, existing facility audits and expansion feasibility for brownfield, regulatory approval planning, master planning and detailed engineering coordination, project management, contractor and vendor evaluation, construction supervision, statutory approvals coordination, commissioning support, and ramp-up advisory for greenfield facilities and brownfield expansions across automotive, pharmaceutical, electronics, food and beverage, chemical, textile, and engineering goods sectors.
→ Schedule a free greenfield and brownfield project scoping consultation with an IMARC specialist
Frequently Asked Questions
A greenfield manufacturing project is a new manufacturing facility developed on previously undeveloped land with complete design freedom. A brownfield manufacturing project involves expansion, modernisation, or reconstruction of an existing facility leveraging existing land, utilities, and approvals while working within legacy constraints.
Brownfield projects delivering equivalent incremental capacity typically require 40-70 percent of greenfield capex due to shared land, utilities, and infrastructure. Structured CAPEX comparison typically shows brownfield savings of 30-60 percent while delivering similar incremental output. Actual ratios depend on scale, sector, and quality of existing infrastructure.
Greenfield projects typically require 18-36 months from concept to commercial production. Complex greenfield projects (semiconductors, integrated automotive, pharmaceutical sterile) may extend to 36-60 months. Brownfield expansions typically require 9-18 months. Simple modernisation may complete in 6-12 months.
Brownfield projects typically deliver 20-35 percent IRR with 2.5-5-year payback. Greenfield projects typically deliver 15-25 percent IRR with 4-7-year payback. Brownfield financial superiority is largely due to lower capex and faster time to cash flow. Greenfield often justifies weaker headline financials through strategic optionality and expansion runway.
Greenfield projects require full new Environmental Clearance under EIA Notification 2006 (typically 12-18 months), Consent to Establish and Consent to Operate, Change of Land Use where applicable, Factory Licence under OSH Code 2020, Fire NOC, and building permissions. Brownfield projects typically operate through amendments to existing approvals compressing regulatory timelines by 40-60 percent. Structured industrial project management sequences approvals with engineering.
Semiconductor fabrication almost always requires greenfield due to specific facility requirements. Pharmaceutical sterile injectables and biologics typically require greenfield for new categories. Automotive OEM new platforms typically require greenfield. Specific chemical hazard categories may require greenfield to comply with buffer zone requirements. Most other sectors support both pathways depending on project objectives.
Yes, structured brownfield execution can maintain production during construction through phased execution planning, live-site construction sequencing, shutdown windows for critical work, and progressive commissioning of new sections. This is a distinctive advantage of brownfield but requires careful project management. Interference with ongoing operations is the single largest brownfield-specific risk.
Capacity requirements exceeding brownfield expansion feasibility typically require greenfield. New geographic markets requiring physical presence favour greenfield. Long-horizon growth trajectories benefit from greenfield expansion runway. Manufacturing plant expansion within existing capacity envelope typically favours brownfield. There is no universal size threshold, sector, product, and strategic horizon all matter.
Structured pre-project surveys (land title, geotechnical, environmental, structural, utility infrastructure), appropriately sized contingency budgets, comprehensive insurance including construction all-risk and delay-in-startup, structured project management with defined risk registers, and experienced project advisory materially reduce risks in both approaches. Approach-specific risks (ramp-up for greenfield, live-site execution for brownfield) require specific mitigation strategies.
Recent Post

Trusted by Industry Leaders
We partner with global enterprises and ambitious businesses across sectors to deliver operational excellence, strategic insights, and sustainable growth through integrated solutions.









Success in Their Words
Real feedback from clients across industries. Discover how our solutions delivered measurable impact and operational excellence.

I wanted to express my sincere appreciation for your efforts in handling this matter. Your dedication and commitment have been truly commendable, and it is evident that you have put in tremendous hard work and expertise into resolving the issues at hand. We are greatly interested in continuing our collaboration with you in the future, as your professionalism and reliability have made you a trusted partner. Thank you once again for your invaluable contribution. We look forward to strengthening our partnership ahead.

It has been a pleasure working with the IMARC team. The insights provided were structured, clear, and highly valuable, helping us strengthen both our technical and financial planning with confidence. We deeply appreciate the team’s professionalism, responsiveness, and attention to detail throughout the engagement. Every requirement was well understood and effectively incorporated, resulting in a comprehensive and actionable output. Overall, our experience has been excellent, and I would gladly recommend IMARC to organizations seeking a reliable research partner.
Your service is truly exceptional. Working with the IMARC team has been a seamless and professional experience. The clarity of communication, responsiveness to queries, and consistent support at every stage made the entire engagement highly efficient. The insights shared were well-structured, practical, and perfectly aligned with our requirements, helping us make informed decisions with confidence. Overall, the dedication and professionalism demonstrated by your team stand out, and I would be glad to recommend IMARC as a reliable and trustworthy research partner.

IMARC did an outstanding job in preparing our study. They were punctual, precise, and consistently responsive throughout the entire process. The team delivered all the data we required in a clear, well-organized, and highly professional format. Their strong attention to detail, combined with their ability to meet every deadline without compromising quality, truly set them apart. Overall, their reliability and commitment made them an exceptional partner for our project, and we would gladly work with them again in the future.

IMARC made the whole process incredibly easy from start to finish. Everyone I interacted with via email was polite, professional, and straightforward to deal with, always keeping their promises regarding delivery timelines and remaining consistently solutions-focused. From my very first contact, I appreciated the professionalism and support shown by the entire IMARC team. I highly recommend IMARC to anyone seeking timely, affordable, and reliable information or advice. My experience with IMARC was excellent, and I truly cannot fault any aspect of it.

I’d like to express my sincere gratitude for the excellent work you accomplished with the study. Your ability to quickly understand our requirements and deliver high-quality results under tight timelines truly reflects your expertise, exceptional work ethic, and unwavering commitment to your customer’s success. The professionalism and responsiveness you demonstrated throughout the process made a significant difference. Our entire team and company are incredibly thankful for your dedication, reliability, and support. Once again, thank you for your outstanding contribution.