Manufacturing
April 13 2026
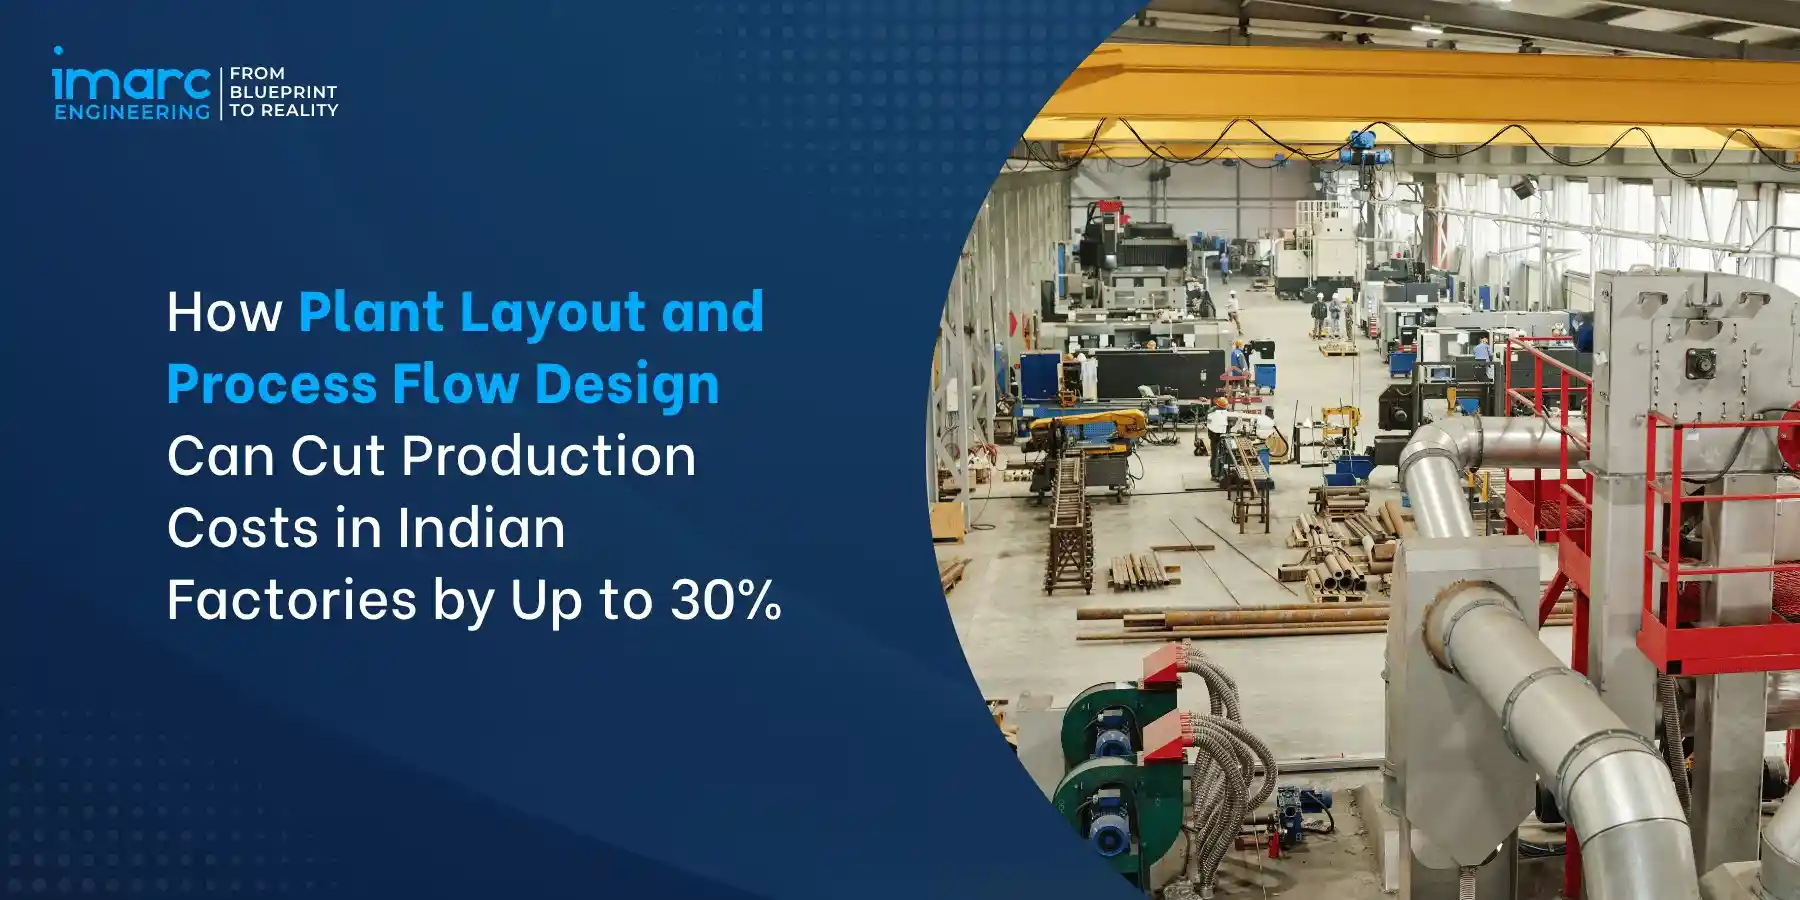
How Plant Layout and Process Flow Design Can Cut Production Costs in Indian Factories by Up to 30%: A Practical Engineering Guide for Manufacturing Leaders
Introduction:
India’s manufacturing sector is in the midst of a structural transformation driven by PLI incentives, China+1 supply chain diversification, and rising domestic consumption. Yet a persistent and underappreciated constraint limits the competitiveness of a large proportion of Indian factories: the way their physical space is organised. Plant layout and process flow design in manufacturing, which involves the spatial and sequential arrangement of machines, workstations, storage areas, and material handling systems, plays a critical role in factory layout design and production flow optimization. This directly determines between 15% and 30% of a facility’s total production cost, according to operational benchmarks compiled across IMARC Engineering’s project portfolio.
The consequences of poor industrial plant layout planning are pervasive and compounding. Excessive material travel distances inflate logistics and labour cost, while inefficient workflow design in factories reduces throughput and increases work-in-process inventory. Poorly planned utility routes increase energy consumption and maintenance access time. Inadequate material handling system design drives fork-lift dependency, product damage, and safety incidents. These inefficiencies are not marginal, in a mid-size Indian factory producing INR 100 crore of output annually, a sub-optimal layout can cost INR 15–30 crore in avoidable operational expenditure every single year.
Drawing on IMARC Engineering’s experience designing and redesigning manufacturing facilities across automotive, pharmaceuticals, food processing, electronics, chemicals, and heavy engineering sectors in India, this guide provides a comprehensive framework for understanding, diagnosing, and correcting layout-driven production cost inefficiencies.
Who This Guide is For: This guide has been prepared for manufacturing plant heads, VP Operations, Chief Engineers, project managers, and investors responsible for greenfield facility design or brownfield layout optimisation projects across India’s industrial sectors including automotive, pharmaceuticals, food processing, electronics, chemicals, and capital goods manufacturing. Whether designing a new facility from scratch or diagnosing cost overruns in an existing plant, the frameworks in this guide apply directly to the Indian manufacturing operating environment.
Table of Contents:
- Introduction
- Section 1: Why Plant Layout Is the Most Undervalued Cost Lever in Indian Manufacturing
- Section 2: Core Layout Typologies and When to Apply Each
- Section 3: Process Flow Design- Eliminating the Hidden Cost of Movement
- Section 4: Material Handling Systems and Their Cost Impact
- Section 5: Utilities, Services, and the Infrastructure Layout Dimension
- Section 6: Integrated Layout Optimisation- The IMARC Engineering Methodology
- Section 7: The Layout Redesign Process- A Step-by-Step Framework
- Section 8: Latest Trends in Factory Layout Design (2025–2026)
- Conclusion
Section 1: Why Plant Layout Is the Most Undervalued Cost Lever in Indian Manufacturing
1.1 The Layout-Cost Relationship: How Space Drives Economics
In India, most manufacturers target their cost savings efforts on the easy targets: raw materials sourcing, labor costs, and energy rates. Facility layout does not figure prominently among the cost considerations at board level, for two reasons. First, facility layout costs are indirect and distributed among material handling costs, labor productivity, inventory holding costs, energy costs, and quality costs. Second, facility layout modifications are often seen as disruptive and costly. Both these assumptions are wrong.
Manufacturing plant layout design and optimization affect production costs via six fundamental principles: first, material movement distances and their associated costs; second, process flow continuity and its influence on WIP and lead times; third, operator motion economy and direct labor productivity; fourth, space utilization economy and its effect on productive capacity per unit of floor space; fifth, utility routing economy and its influence on energy and maintenance costs; and sixth, quality systems integration and the question of whether facility layouts facilitate or impede quality inspection, batching, and contamination control.
1.2 The Cost Impact of Poor Layout: A Quantified View
Table 1: Quantified Cost Impact of Layout-Driven Inefficiencies- Indian Factory Benchmarks
| Inefficiency Type | Cost Mechanism | Addressability |
|---|---|---|
| Excessive material travel distance | Direct labour time, fork-lift hours, WIP accumulation | High- layout redesign |
| Process flow discontinuity | Working capital tied in buffer stocks, space cost | High- sequence redesign |
| Poor workstation ergonomics & motion | Labour productivity loss, quality defect rate | Medium- layout + method study |
| Underutilised floor area | Depreciation, lease cost per unit of output | Medium- space consolidation |
| Inefficient utility routing | Pipe/cable losses, maintenance access cost | Medium- utility layout redesign |
| Inadequate receiving/dispatch design | Material waste, rework, customer returns | High- dock and staging redesign |
1.3 Why Indian Factories Are Particularly Vulnerable to Layout Inefficiency
There are several reasons why layout problems are so common and expensive in Indian manufacturing industries. First, historical growth pattern: many Indian manufacturers did not have an integrated factory originally designed and built. Instead, their factories were developed through organic expansion, with new production, storage, and utility lines being added along with the growth of the business, without proper layout considerations.
Second, high land and construction costs: in many Indian industrial districts, the prices for acquiring lands and building factories have gone up, leading to the need for efficient use of factory space. This need, when combined with inefficient layout planning, often results in overcrowded factories with poor ventilation and narrow flow paths.
Third, labor-cost ratio: traditionally low salaries in India made it less important to cut down on motion waste or maximize ergonomic efficiency. With the cost of labor growing in Indian manufacturing, including skilled labor, the negative impacts of layout problems become increasingly relevant.
Section 2: Core Layout Typologies and When to Apply Each
2.1 The Four Primary Layout Types and Their Cost Profiles
The arrangement of a manufacturing plant layout design is not a singular science but rather a cluster of designs that depend on the production volume, diversity, product architecture, and regulatory factors. Cost analysis of various types of layouts is the beginning of optimization of the layout arrangement.
Table 2: Layout Typology Comparison- Cost Profile and Indian Application Context
| Layout Type | Best For | Cost Advantage | Cost Risk | Indian Sector Examples |
|---|---|---|---|---|
| Process Layout (Functional) | High-variety, low-volume production; job shops | Equipment flexibility; easier maintenance access | High material travel distance; WIP accumulation; complex scheduling | Job shop machining, tool rooms, custom fabrication |
| Product Layout (Line) | Low-variety, high-volume production; assembly | Minimum material travel; low WIP; high throughput | Inflexibility to product mix changes; high changeover cost | FMCG packaging, automotive assembly, electronics SMT lines |
| Cellular Layout (Group Technology) | Medium variety, medium volume; family-based production | Balanced flow; reduced changeover; team accountability | Requires product family analysis; cell balancing complexity | Automotive components, precision machining, pharma primary packaging |
| Fixed Position Layout | Large, heavy, or immovable products | Eliminates product movement; suits site-assembled products | High resource movement cost; complex logistics co-ordination | Heavy fabrication, shipbuilding, large pressure vessels, infrastructure |
2.2 The Cellular Manufacturing Advantage in Indian Context
Cellular layout, which involves arranging machines, stations, and labor into production cells devoted to producing specific families of products, has repeatedly provided the best blend of cost savings and flexibility when used in IMARC Engineering’s Indian factories. Cellular layout offers a lower material handling cost due to 30-50% shorter material handling distances than equivalent process layouts; it lowers work-in-process inventories by 30-50% through implementing flow within the cell; it enhances quality through ownership by teams of the quality of cell output; and it facilitates quicker changeovers because all resources required for a product family are co-located.
Indian auto component makers and tablet production lines in pharmaceutical plants have been some of the most effective users of cellular layout concepts, saving costs by 10-25% in just 12-18 months after cell implementation.
2.3 Hybrid Layouts: The Reality of Indian Factory Optimisation
In practice, the majority of factories in India catering to many markets, each having a wide variety of products, must adopt hybrid layouts, with product line layout for high volume standardized products, cellular layout for medium volume product groups, and flexible functional layout for custom-made products. This implies that the challenge is in drawing the dividing lines in such a manner that material flow from one section to another is minimized.
IMARC Engineering Insight: In our brownfield layout optimisation engagements, the most impactful single change is typically the transition from a pure process layout, where all machines of the same type are grouped together regardless of product routing, to a product-family cellular arrangement. This transition alone typically yields 25–40% reduction in material travel distance and a 15–25% reduction in lead time within the first operating year.
Section 3: Process Flow Design- Eliminating the Hidden Cost of Movement
3.1 Process Flow Analysis: Mapping the True Cost of Production Routing
Process flow design can be defined as the science of production flow optimization in manufacturing, focusing on operation sequencing, material movement, and workflow efficiency. In badly designed manufacturing facilities, process flows become a last-minute consideration where the order of operations became a result of equipment selection, space availability, and previous tradition rather than proper flow analysis. The financial impact is profound and layered.
The process flow analysis technique used at IMARC Engineering commences with an in-depth From-To Chart Analysis: a matrix that shows the distances between each pair of stations in the factory in terms of material handling distance. The consistent finding from such analysis is that in factories with improper layouts, 60 to 80 percent of total material handling distance occurs between station pairs that are not physically close to each other but can be re-ordered or moved.
3.2 The Seven Sources of Flow Waste in Indian Factories
Drawing from lean manufacturing principles and adapted for the Indian factory context, IMARC Engineering identifies seven recurring sources of flow waste in Indian manufacturing operations:
- Backtracking flow: materials routed back through zones they have already passed, adding distance and handling steps, present in over 70% of unoptimised Indian factory layouts.
- Cross-flow interference: production routes that cross each other, creating congestion points and collision risk in material handling corridors.
- Excessive inter-departmental transfer: products crossing departmental or building boundaries multiple times due to functional layout organisation.
- Buffer accumulation zones: informal storage points that develop wherever flow discontinuities exist, consuming floor space and obscuring quality problems.
- Long changeover transit: operators and tooling travelling excessive distances during product changeover, inflating changeover time by 15–30% above theoretical minimum.
- Inspection station isolation: quality checkpoints located away from the process they inspect, creating delay between defect occurrence and detection.
- Dispatch staging inefficiency: finished goods accumulating in unstructured areas due to inadequate dispatch staging design, causing product damage and order fulfilment delays.
3.3 Flow Design for Regulated Industries: GMP and Quality Integration
While process flow design holds importance for the manufacturing processes of various industries such as the pharmaceutical industry, food products, and medical devices, process flow design requires consideration of an added dimension related to the need for separation of material flows and personnel flows, logical operation sequence for tracing batch production processes, and environmental zone creation to sustain product quality from process start to finish. For GMP-regulated processes, an improperly designed process flow is a risk issue which can prompt regulatory intervention.
The approach taken by IMARC Engineering to incorporate GMP flow design considerations such as directional flow, airlocks for people and materials, separation of dirty and clean corridors, and zone considerations into the process flow design phase will help meet compliance and cost efficiency objectives simultaneously.
📊 Is Your Factory Losing 15–30% of Production Cost to Poor Layout?
IMARC Engineering conducts comprehensive plant layout design and process flow optimization assessments for Indian factories across all sectors. We quantify the cost of your current layout and deliver a prioritised redesign roadmap with a clear ROI model, before a single machine is moved.
➤ Request a Plant Layout Cost Assessment
Section 4: Material Handling Systems and Their Cost Impact
4.1 The True Cost of Material Handling in Indian Factories
Material handling, the movement, storage, protection, and control of materials and products throughout the manufacturing process, accounts for 15–70% of total product cost in manufacturing environments, according to the Material Handling Industry of America benchmarks. In Indian factories, where material handling systems have often evolved incrementally rather than been designed systematically, the figure is typically at the higher end of this range.
The direct cost components of material handling include equipment purchase and maintenance (fork-lifts, conveyors, cranes, pallet trucks, AGVs), labour for material movement and staging, packaging and palletisation materials consumed in internal transfers, and product damage sustained during handling. But the indirect cost components are equally significant: floor space consumed by handling equipment and its operational clearances, production delays caused by material unavailability at the point of use, quality losses caused by excessive handling steps, and safety incidents associated with mobile equipment.
Table 3: Material Handling System Comparison- Cost Profile for Indian Factory Contexts
| Handling System | Best Application | Operating Cost Profile | Indian Adoption Context |
|---|---|---|---|
| Manual handling (trolleys, carts) | Light loads, short distances, low volume | High labour dependency; ergonomic risk above 15 kg | Dominant in Indian SME sector; significant hidden cost |
| Counter-balance fork-lift trucks | Pallet loads, medium distances, flexible routing | INR 3–7 lakh/year per unit incl. operator and maintenance | Ubiquitous in Indian factories; often over-relied upon |
| Overhead cranes & hoists | Heavy loads, fixed routing between fixed stations | Low operating cost; high installation cost | Standard in heavy fabrication, foundry, press shops |
| Roller/belt conveyors | High-volume flow, fixed routing, light-medium loads | Low labour cost; limited to fixed routes | FMCG, pharma packaging, automotive final assembly |
| Automated Guided Vehicles (AGVs) | Repetitive routes, 24/7 operations, high labour cost environments | Low labour; high maintenance and programming cost | Emerging in large Indian automotive and pharma plants |
| Automated Storage & Retrieval (AS/RS) | High SKU density, fast order fulfilment, limited space | Very low labour; significant systems integration cost | Limited to large-scale FMCG and e-commerce warehousing |
4.2 The Fork-Lift Dependency Problem in Indian Manufacturing
One of the most pervasive material handling cost drivers in Indian factories is excessive fork-lift dependency, the use of fork-lift trucks as the default internal material transport mechanism even for loads, distances, and frequencies for which more efficient alternatives exist. Fork-lift dependency is costly on multiple dimensions: each fork-lift requires a licensed operator whose full-loaded annual cost is INR 3.5–6 lakh; fork-lifts require 2.5–3.5 metre aisle widths that consume 15–25% of factory floor area; fork-lift incidents are the leading cause of factory floor injuries in India; and fork-lift operations consume significant diesel or battery energy.
In IMARC Engineering’s factory optimisation projects, a systematic transition from fork-lift-dependent to gravity-flow, conveyor-assisted, or tugger-train-based internal logistics typically yields 25–40% reduction in material handling cost within 18–24 months, while simultaneously freeing floor space, improving safety, and reducing aisle width requirements.
4.3 Warehouse and Storage Layout Integration
The integration of raw material storage, work-in-process staging, and finished goods warehousing into the overall factory layout is a frequently underestimated dimension of layout optimisation. In many Indian factories, storage areas have grown organically, occupying whatever space was available rather than being positioned to minimise material travel to and from production. A systematic storage layout design, placing raw material storage adjacent to first-operation workstations and finished goods staging adjacent to dispatch docks, with work-in-process staging integrated within or immediately adjacent to production cells, can reduce material handling distances by 30–50% and reduce inventory carrying cost by improving stock visibility and rotation.
Section 5: Utilities, Services, and the Infrastructure Layout Dimension
5.1 How Utility Layout Drives Energy and Maintenance Cost
The layout of utility distribution systems, compressed air pipework, electrical distribution, steam and condensate lines, chilled water circuits, natural gas pipework, and process water systems is one of the most consequential and least-analysed dimensions of factory layout optimisation. In Indian factories designed without a systematic utility layout master plan, the combination of long distribution runs, inadequately sized pipes and cables, poorly positioned pressure drops, and difficult maintenance access typically adds 10–20% to energy operating cost and significantly increases maintenance time and cost.
The principle of utility layout optimisation is straightforward: position high-consumption equipment close to utility supply points; design distribution networks as balanced ring mains rather than long radial feeds; size distribution elements for the facility’s design capacity rather than current load; and provide standardised maintenance access throughout. In practice, applying these principles to an existing facility requires a systematic utility audit followed by a structured improvement programme, exactly the approach IMARC Engineering takes in brownfield utility layout engagements.
Table 4: Utility Layout Optimisation- Typical Cost Impact in Indian Factories
| Utility System | Common Layout Problem | Optimisation Approach |
|---|---|---|
| Compressed air | Undersized mains; excessive distribution length; unmetered leakage | Ring main design; leak detection programme; pressure zone optimisation |
| Electrical distribution | Overloaded panels: long cable runs to high-draw equipment; poor power factor | Equipment clustering near substations; power factor correction; energy monitoring |
| Steam and condensate | Uninsulated lines; failed steam traps; poor condensate return | Insulation audit; steam trap replacement programme; condensate return maximisation |
| Process water and ETP | Oversized pump systems; gravity flow opportunities unused; poor metering | Hydraulic optimisation; gravity flow utilisation; sub-metering by process area |
| Compressed gases (N2, O2, CO2) | Cylinder-based supply where bulk or pipeline more cost-effective | Supply mode analysis; pipeline installation where justified |
5.2 HVAC and Environmental Control Layout
Where production is temperature-sensitive, pharmaceuticals, food, electronics, and precision manufacturing need HVAC and environmental control planning that is not just about cost but about quality and compliance. In GMP-regulated plants, cleanrooms must be maintained at specific cleanroom classification and pressure differential between zones; food plants must control temperature and humidity to avoid contamination; electronics assembly requires ESD control and humidity regulation within the entire production process.
The essential planning element in HVAC optimization is zoning: creating zones with like environmental control needs and providing each zone with dedicated HVAC units instead of trying to provide uniform environmental control in an entire plant where conditions differ from one end to the other. The result is reduced HVAC plant size, increased accuracy in control, and savings of 20–35% in operating costs over uniform conditioning of the entire plant.
5.3 Fire Safety, Emergency Egress, and Regulatory Compliance in Layout Design
Factory layout design in India should conform to the specifications outlined in the National Building Code, the Factory Act, local fire safety codes, and in some cases, even international guidelines such as NFPA and FM Global. Any deviations from these guidelines in terms of inappropriate design layouts, narrow aisles, obstruction of emergency exits, poor fire suppression systems, or improper handling of dangerous materials pose both legal risks and possible operational hazards. IMARC Engineering considers fire safety needs, emergency egress, and hazardous classifications while designing the layout, and does not view them as secondary considerations to the primary factory design.
⚠ Is Your Utility Layout Costing You INR 20–50 Lakh Every Year?
Poorly routed compressed air, steam, electrical distribution, and process water systems silently drain profitability in most Indian factories. IMARC Engineering’s utility layout audit identifies every point of energy and cost leakage and delivers a pragmatic remediation plan with a clear payback timeline.
➤ Book a Utility Layout Audit
Section 6: Integrated Layout Optimisation- The IMARC Engineering Methodology
6.1 The Integration Imperative: Why Piecemeal Layout Changes Fail
The most common failure mode in factory layout improvement programmes is piecemeal intervention: moving a single bottleneck machine, reconfiguring one storage area, or adding a conveyor in one section without considering the system-wide impact. Piecemeal changes frequently solve one bottleneck while creating another, improve flow in one section while degrading it in another, and consume capital investment without delivering proportionate cost improvement.
An integrated layout optimisation approach treats the factory as a system: all material flows, all space allocations, all utility distributions, and all personnel movement patterns are analysed and optimised simultaneously, using a structured methodology that models the interdependencies between decisions before any physical change is made. This systems approach is more complex and requires more upfront analytical investment, but it is the only approach that consistently delivers the 10–30% cost reductions that layout optimisation is capable of achieving.
6.2 The Systematic Layout Planning (SLP) Framework
IMARC Engineering’s layout optimisation methodology is grounded in the Systematic Layout Planning (SLP) framework originally developed by Richard Muther, adapted and extended for the Indian manufacturing context. SLP structures the layout design process through a logical sequence: activity relationship analysis (what must be close to what, and why); space requirement determination (how much space does each activity need, under future capacity scenarios); space relationship diagramming (translating closeness requirements into spatial arrangements); and layout evaluation and selection (comparing alternative layouts against quantified cost, flow, and compliance criteria).
The output of a well-executed SLP process is not a single “best” layout but a small set of genuinely distinct layout alternatives, each with a quantified cost-benefit profile, enabling management to make an informed decision that balances cost optimisation against operational risk, capital availability, and implementation disruption tolerance.
6.3 Digital Tools for Layout Optimisation
Modern factory layout optimisation is supported by a range of digital tools that significantly improve the quality and speed of the design process. AutoCAD-based 2D layout drafting remains the standard for detailed facility drawings; however, IMARC Engineering increasingly uses 3D facility modelling (using tools such as Revit and Factory Design Utilities) to identify spatial conflicts, optimise material flow paths, and communicate design intent to clients before implementation. Discrete event simulation tools allow IMARC engineers to model the dynamic behaviour of a proposed layout under varying production loads, identifying bottlenecks, validating throughput assumptions, and testing the robustness of the layout under peak demand scenarios.
For brownfield assessments, 3D laser scanning (LiDAR) provides a highly accurate as-built record of existing facility conditions, eliminating the measurement errors that frequently invalidate layouts designed from outdated or incomplete drawings. The scan data is processed into a point cloud that can be directly imported into layout design software, significantly reducing the time and cost of the baseline assessment phase.
IMARC Engineering Insight: In our experience, the single most valuable investment in a layout optimisation project is the quality of the baseline data, accurate as-built dimensions, verified machine footprints, measured material flow volumes, and timed operator motion studies. Layout designs based on assumed or estimated data consistently underperform against their projected cost savings. Investing in a rigorous baseline assessment is not overhead, it is the foundation of a reliable return on the layout investment.
Section 7: The Layout Redesign Process- A Step-by-Step Framework
7.1 IMARC Engineering’s Five-Phase Layout Optimisation Methodology
Phase 1- Baseline Assessment and Flow Analysis
The starting point is a comprehensive assessment of current facility conditions: as-built floor plan verification (using 3D scan or physical measurement), machine and workstation inventory with dimensions, From-To material flow analysis, operator motion study, utility system mapping, storage capacity audit, and identification of current bottlenecks and safety deficiencies. This phase produces a quantified baseline, measured material travel distance, measured WIP levels, measured operator utilisation, and measured space utilisation ratios, against which improvement options will be evaluated.
Phase 2- Activity Relationship and Space Requirement Analysis
Using the From-To flow data and process knowledge, IMARC engineers develop an activity relationship chart (A-E-I-O-U-X) quantifying the importance of proximity between each pair of activities. Space requirements are determined for each activity under the design production capacity, including allowances for equipment, operator movement, material staging, aisle access, and maintenance clearances. The space relationship diagram translates these requirements into a dimensioned adjacency model that becomes the template for layout development.
Phase 3- Layout Alternative Development and Evaluation
IMARC engineers develop two to four fundamentally distinct layout alternatives, each honouring the most critical adjacency requirements but making different trade-offs in handling the constraints unique to the facility, structural columns, utility entry points, expansion provisions, and regulatory zoning requirements. Each alternative is evaluated against a weighted scorecard covering material flow efficiency (quantified by total weighted material travel distance), capital cost of implementation, operational disruption during transition, compliance performance, and flexibility to accommodate future capacity growth.
Phase 4- Detailed Design and Implementation Planning
The selected layout is developed to detailed design level, including: dimensioned floor plan with machine positions, aisle layouts, material handling equipment routing, storage allocation, utility connection points, and fire safety provisions. A phased implementation plan is developed to minimise production disruption during the transition, critical in Indian factories where production continuity is non-negotiable during peak seasons. The implementation plan specifies the sequence of machine relocations, utility connection changes, floor marking updates, and training interventions required to achieve the target layout.
Phase 5- Implementation Oversight and Performance Verification
IMARC Engineering provides on-site implementation oversight to ensure that the physical changes are executed in accordance with the design, that unforeseen conditions are addressed without compromising the layout’s flow optimisation objectives, and that the new layout’s performance is measured and verified against the projected cost savings. Post-implementation performance verification typically takes place at 3, 6, and 12 months, confirming that the targeted material travel distance reductions, throughput improvements, and cost savings are being realised.
7.2 Common Mistakes in Factory Layout Redesign
- Designing for current production volumes without modelling future capacity requirements, resulting in a layout that is already sub-optimal within 3–5 years of implementation.
- Ignoring the transition plan: relocating machines without a sequenced plan that maintains production continuity creates costly production shutdowns.
- Treating utility systems as secondary to production layout: utility redesign deferred after the production layout is fixed almost always requires expensive compromises to the utility system.
- Over-relying on computer optimisation tools without physical flow observation: simulation models are only as good as their input data, and the most important input data comes from direct observation on the factory floor.
- Failing to engage the workforce: operators who work with the processes daily have invaluable knowledge about informal workarounds, intermittent problems, and improvement opportunities that are invisible to outside designers.
Section 8: Latest Trends in Factory Layout Design (2025–2026)
Industry 4.0 Integration Driving Layout Reconfiguration
The adoption of Industry 4.0 technologies in Indian manufacturing including industrial IoT sensors, robotic process automation, autonomous mobile robots (AMRs), and digital twin simulation is driving a significant reconfiguration of factory layouts across the automotive, electronics, and pharmaceutical sectors. AMRs, which navigate autonomously and can follow dynamically updated routes, are reducing the aisle width requirements associated with traditional fork-lift operations, allowing floor space to be reclaimed for production. Digital twin technology is enabling Indian manufacturers to simulate layout changes and production flow scenarios in a virtual environment before committing to physical implementation, significantly reducing the risk of costly layout redesign mistakes.
PLI-Driven Greenfield Investments Creating New Layout Design Opportunity
India’s Production Linked Incentive schemes have catalysed a wave of new greenfield manufacturing investments across semiconductors, electronics, pharmaceuticals, advanced chemicals, and food processing. For these projects, where the factory is being designed from a blank sheet rather than retrofitted within an existing structure, the layout design opportunity is maximised. IMARC Engineering is engaged in multiple PLI-linked greenfield projects where integrated layout design from the outset is delivering projected cost structures 20–30% below benchmarks for equivalent brownfield operations. The lesson for greenfield investors is clear: layout optimisation investment at the design stage is the highest-return compliance and engineering expenditure in the project.
Sustainability and Net-Zero Commitments Reshaping Layout Priorities
Indian manufacturers supplying global brands are facing increasing pressure to reduce their Scope 1 and Scope 2 carbon emissions as part of their customers’ supply chain sustainability commitments. Factory layout is a meaningful lever in this effort: optimised utility distribution reduces energy consumption; natural lighting integration through optimised roof and clerestory design reduces artificial lighting energy; and the co-location of rooftop solar capacity with high-consumption equipment reduces transmission losses. IMARC Engineering now integrates a sustainability performance scorecard into its layout evaluation methodology, enabling clients to select layouts that deliver both cost and carbon performance simultaneously.
Modular and Reconfigurable Factory Design Gaining Traction
The experience of supply chain disruptions, rapid demand shifts, and PLI-driven capacity expansion has increased Indian manufacturer interest in modular factory design, layouts that can be reconfigured without major civil engineering intervention as product mix, volume, or process technology changes. Modular approaches include standardised machine base dimensions that facilitate repositioning without floor modification, plug-and-play utility connection points at regular grid intervals throughout the production floor, and cellular layout structures that can be replicated or contracted as required. IMARC Engineering incorporates modular design principles into new facility layouts for clients who anticipate significant product mix evolution over the facility’s life cycle.
Conclusion:
Plant layout and process flow design represent the most systematically underutilised cost reduction lever available to Indian manufacturers. The evidence is consistent across sectors and facility types: well-designed layouts reduce material handling cost by 20–40%, reduce WIP inventory by 25–50%, improve operator productivity by 10–18%, reduce energy cost by 10–20%, and deliver aggregate production cost reductions of 15–30%, all without the capital intensity of new equipment or the complexity of new product development.
The strategic case for layout optimisation investment is reinforced by the current context of Indian manufacturing: PLI-driven greenfield projects present a once-in-a-generation opportunity to get the layout right from the outset; rising labour costs are increasing the productivity premium of well-designed workstation ergonomics; sustainability commitments are adding energy efficiency to the layout design agenda; and competition for skilled manufacturing talent is making operator-friendly, well-organised production environments a retention and recruitment advantage.
Manufacturers who invest in rigorous, systematic layout optimisation, executed with the analytical discipline and engineering depth that the discipline demands will build a structural cost advantage that compounds over the full operating life of their facilities. Those who defer this investment will continue to carry the hidden cost of sub-optimal layout in every unit of output they produce.
Whether you are evaluating a greenfield facility design, investigating unexplained cost overruns in an existing plant, or planning a major expansion, IMARC Engineering provides end-to-end plant layout analysis, process flow design, material handling system specification, and implementation oversight. Contact our team to discuss your facility requirements at sales@imarcengineering.com.
Frequently Asked Questions
Most factory layout redesigns in Indian facilities are implemented in phases over a 6–18 month period, timed to coincide with planned maintenance shutdowns, seasonal demand troughs, and production line changeovers. The phased implementation approach ensures that production continuity is maintained throughout the transition. In our experience, the most common implementation structure is a weekend-by-weekend machine relocation programme, where significant moves are executed during planned stoppages and production resumes on Monday in the new configuration. For larger relocations, a planned 3–5 day shutdown is sometimes required, but this is the exception rather than the rule with proper sequencing.
For brownfield layout optimisation projects in Indian factories, IMARC Engineering’s post-implementation tracking across our project portfolio shows a median payback period of 8–18 months from completion of implementation. The fastest payback is typically achieved in facilities where material handling cost and WIP inventory reductions are the primary benefit drivers, these savings begin immediately upon layout implementation. Energy cost savings from utility system redesign typically take 3–6 months to fully manifest as operating cost reductions. Quality loss reductions, which are often significant but harder to measure precisely, typically become measurable in 6–12 months.
The minimum data required to initiate an IMARC Engineering layout optimisation engagement includes: existing floor plan drawings (or permission to conduct a physical measurement survey); a list of all production equipment with approximate footprints; a description of the primary products manufactured and their production routing; and current production volumes and growth projections. We can work with incomplete or approximate data to develop a preliminary analysis, and our engagement process is designed to supplement client data with our own field observations and measurements. The quality of baseline data is the most critical factor in the accuracy of layout improvement projections.
Yes, and the methodology differs significantly between the two. For greenfield facilities, layout design begins with a clean-sheet opportunity: all layout elements can be positioned optimally, utility systems can be designed from the outset for the production layout, and structural elements can be located to minimise interference with flow. The result is consistently a 15–25% lower production cost structure compared to equivalent brownfield operations. For brownfield facilities, layout optimisation works within structural, utility, and production continuity constraints to identify and implement the highest-value improvements available within those constraints. Both contexts deliver significant cost reduction, but the analytical approach, implementation plan, and investment level differ.
Regulated manufacturing sectors require layout designs that simultaneously satisfy process flow optimisation objectives, GMP compliance requirements, and regulatory zoning specifications. IMARC Engineering’s teams combine factory layout engineering expertise with regulatory knowledge including Schedule M, WHO-GMP, EU GMP, FSSC 22000, and ISO 13485 requirements, to deliver layouts that are both operationally efficient and compliance-ready. We do not treat GMP requirements as constraints to be accommodated after the production layout is fixed; we integrate them as primary design parameters from the outset of the SLP process. This approach eliminates the retrofit compliance costs that are common when layout and compliance design are handled separately.
IMARC Engineering provides plant layout and process flow design services across India’s full manufacturing geography, serving clients in automotive and EV components, pharmaceuticals and medical devices, food and beverage processing, electronics and semiconductor assembly, chemicals and specialty chemicals, heavy fabrication, and capital goods. Our teams are active across Maharashtra, Gujarat, Tamil Nadu, Telangana, Karnataka, Andhra Pradesh, Haryana, Punjab, Rajasthan, and Uttar Pradesh covering both established industrial zones and emerging PLI-linked manufacturing corridors. Contact our team to discuss your specific facility requirements at imarcengineering.com.
Recent Post


Trusted by Industry Leaders
We partner with global enterprises and ambitious businesses across sectors to deliver operational excellence, strategic insights, and sustainable growth through integrated solutions.
Success in Their Words
Real feedback from clients across industries. Discover how our solutions delivered measurable impact and operational excellence.

I wanted to express my sincere appreciation for your efforts in handling this matter. Your dedication and commitment have been truly commendable, and it is evident that you have put in tremendous hard work and expertise into resolving the issues at hand. We are greatly interested in continuing our collaboration with you in the future, as your professionalism and reliability have made you a trusted partner. Thank you once again for your invaluable contribution. We look forward to strengthening our partnership ahead.

It has been a pleasure working with the IMARC team. The insights provided were structured, clear, and highly valuable, helping us strengthen both our technical and financial planning with confidence. We deeply appreciate the team’s professionalism, responsiveness, and attention to detail throughout the engagement. Every requirement was well understood and effectively incorporated, resulting in a comprehensive and actionable output. Overall, our experience has been excellent, and I would gladly recommend IMARC to organizations seeking a reliable research partner.

Your service is truly exceptional. Working with the IMARC team has been a seamless and professional experience. The clarity of communication, responsiveness to queries, and consistent support at every stage made the entire engagement highly efficient. The insights shared were well-structured, practical, and perfectly aligned with our requirements, helping us make informed decisions with confidence. Overall, the dedication and professionalism demonstrated by your team stand out, and I would be glad to recommend IMARC as a reliable and trustworthy research partner.

IMARC did an outstanding job in preparing our study. They were punctual, precise, and consistently responsive throughout the entire process. The team delivered all the data we required in a clear, well-organized, and highly professional format. Their strong attention to detail, combined with their ability to meet every deadline without compromising quality, truly set them apart. Overall, their reliability and commitment made them an exceptional partner for our project, and we would gladly work with them again in the future.

IMARC made the whole process incredibly easy from start to finish. Everyone I interacted with via email was polite, professional, and straightforward to deal with, always keeping their promises regarding delivery timelines and remaining consistently solutions-focused. From my very first contact, I appreciated the professionalism and support shown by the entire IMARC team. I highly recommend IMARC to anyone seeking timely, affordable, and reliable information or advice. My experience with IMARC was excellent, and I truly cannot fault any aspect of it.

I’d like to express my sincere gratitude for the excellent work you accomplished with the study. Your ability to quickly understand our requirements and deliver high-quality results under tight timelines truly reflects your expertise, exceptional work ethic, and unwavering commitment to your customer’s success. The professionalism and responsiveness you demonstrated throughout the process made a significant difference. Our entire team and company are incredibly thankful for your dedication, reliability, and support. Once again, thank you for your outstanding contribution.